A Look Back at the 2025 Whistler Real Estate Market
The Whistler real estate market in 2025 was a story of balance, patience, and selective buyer activity.
While overall sales softened slightly compared to 2024, the market was far from quiet. Buyers were still active, especially when the right property came along. What changed was the type of property buyers were responding to, and how carefully they were making decisions.
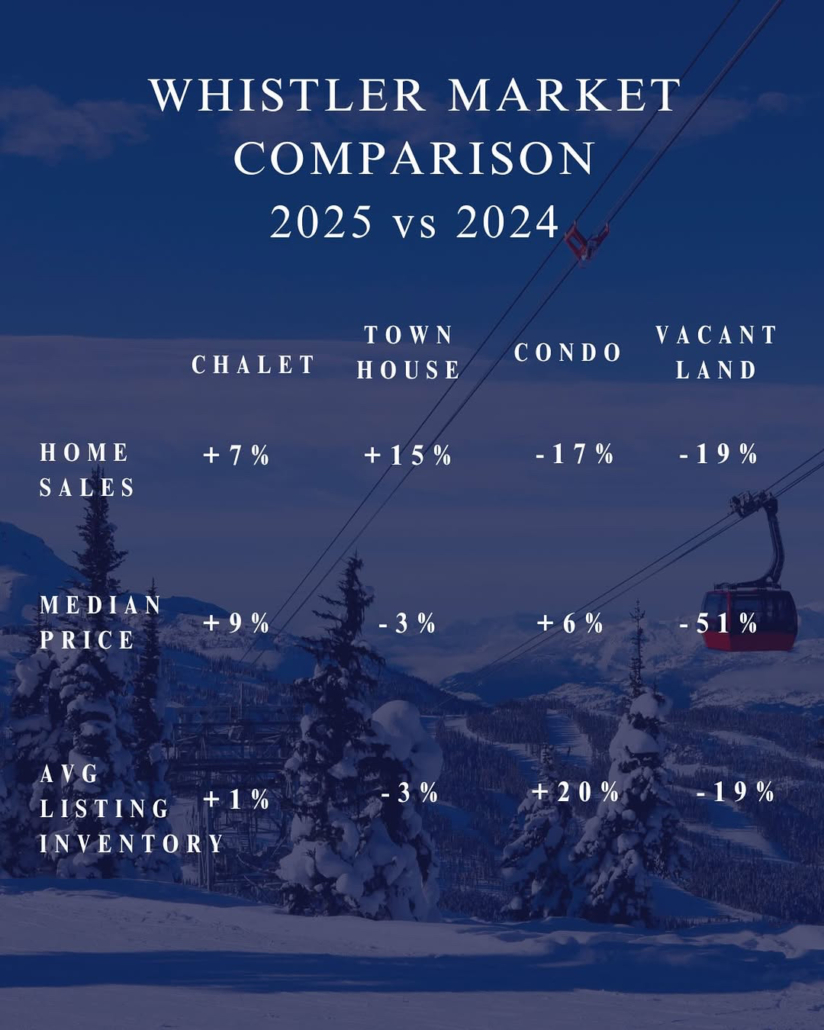
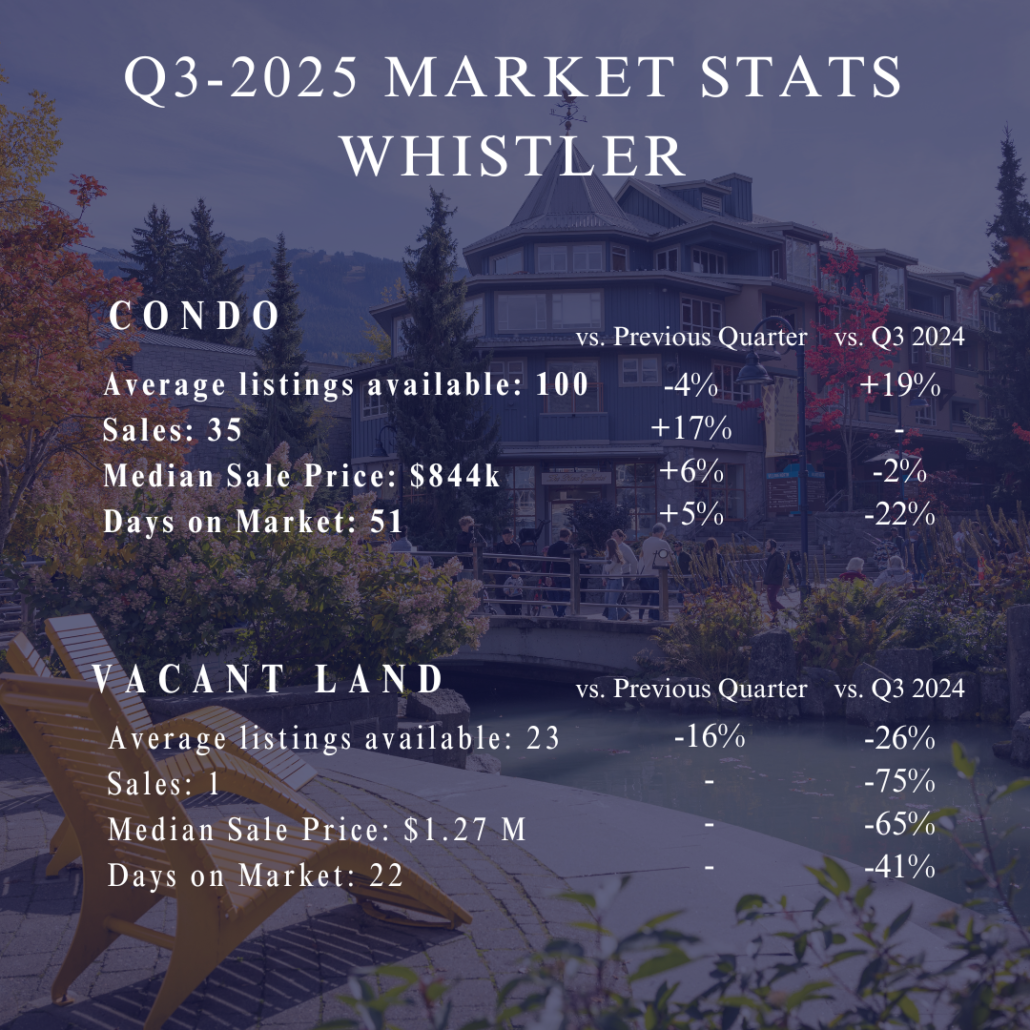
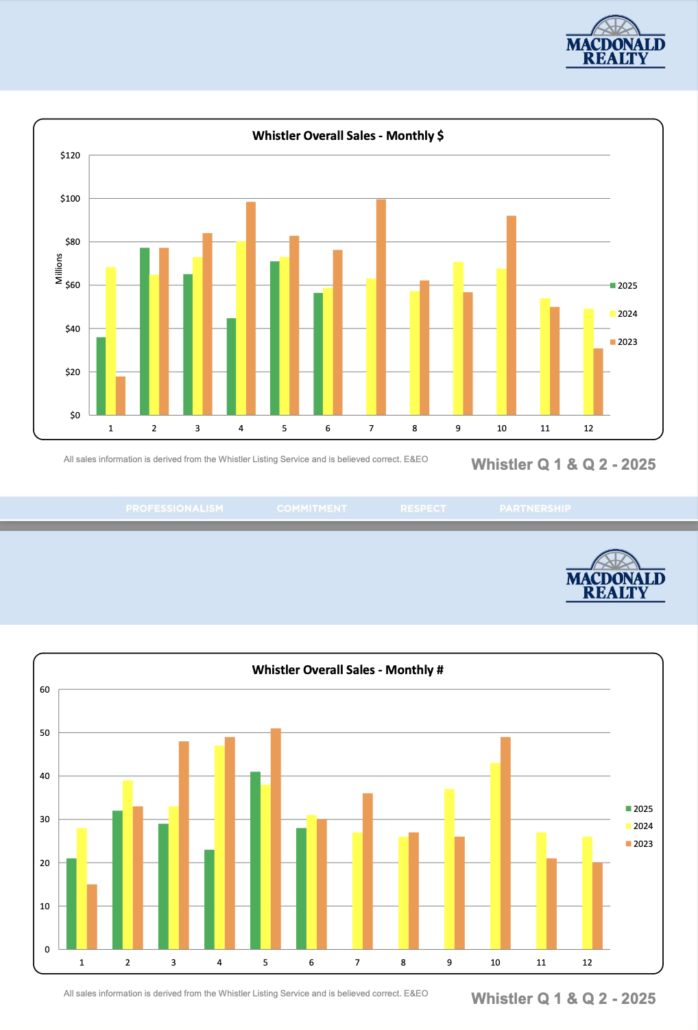
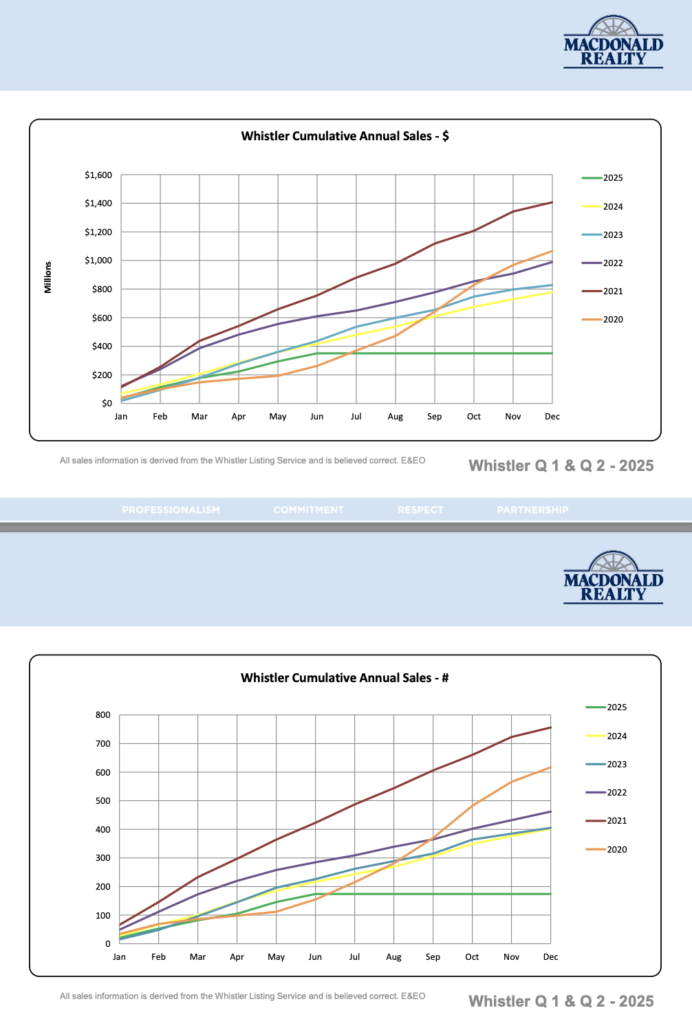
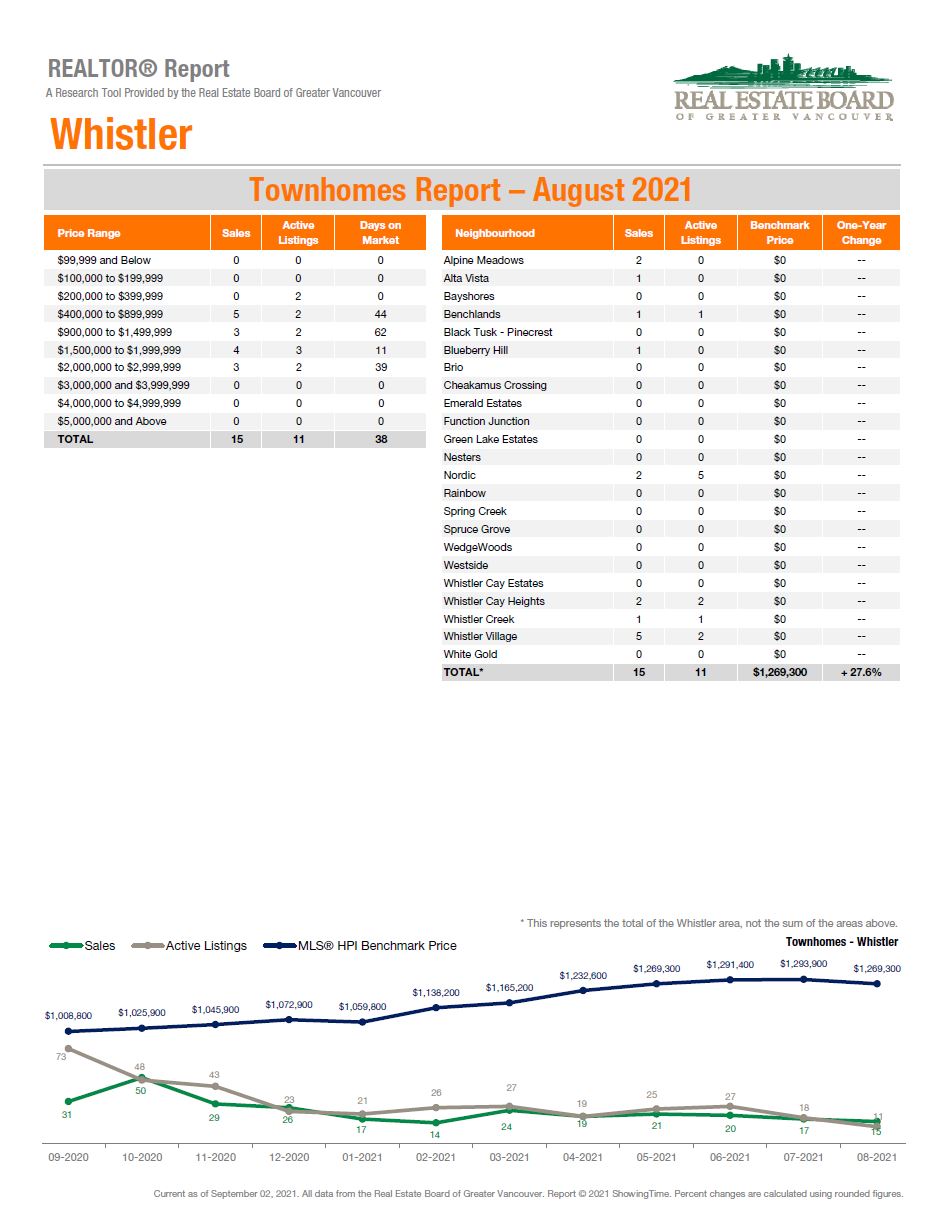
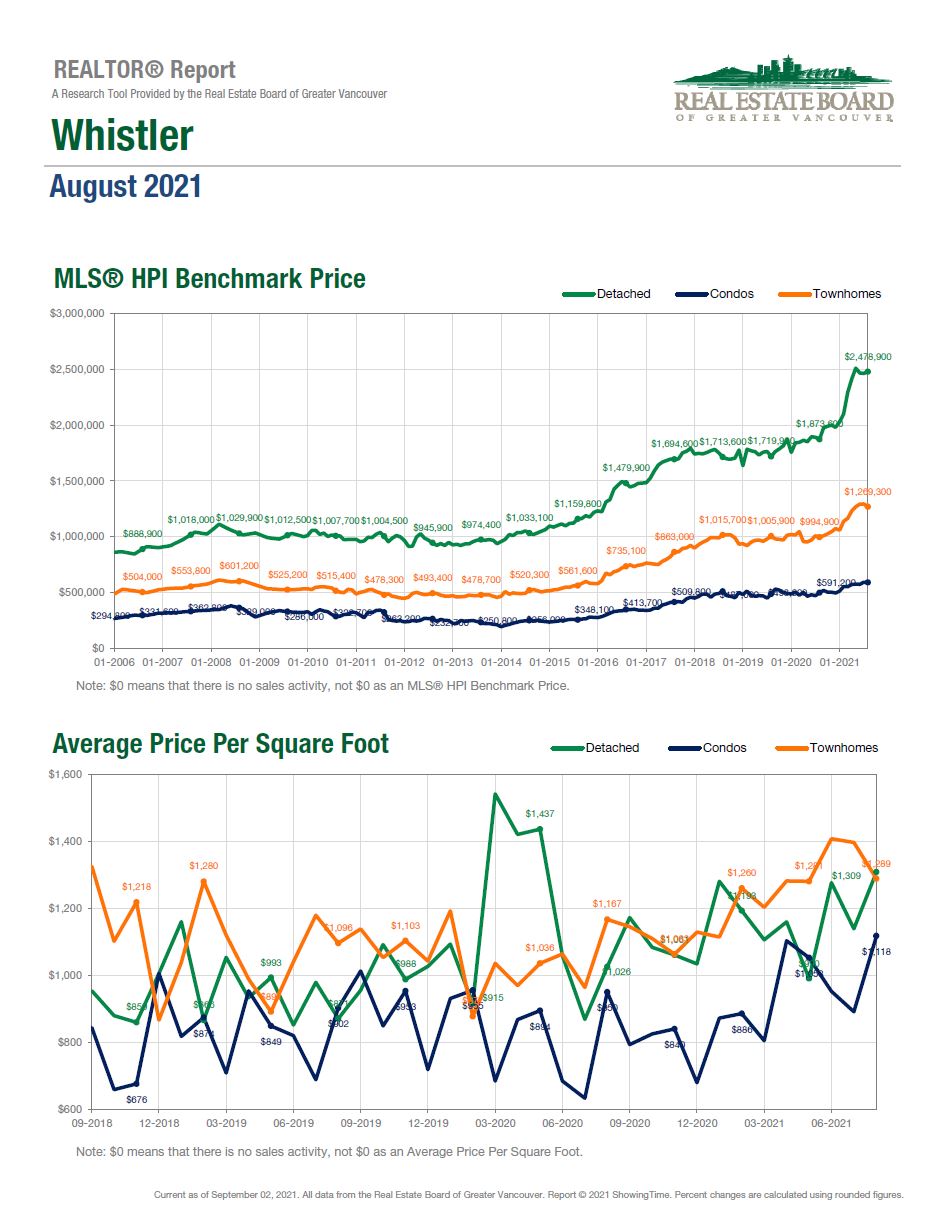
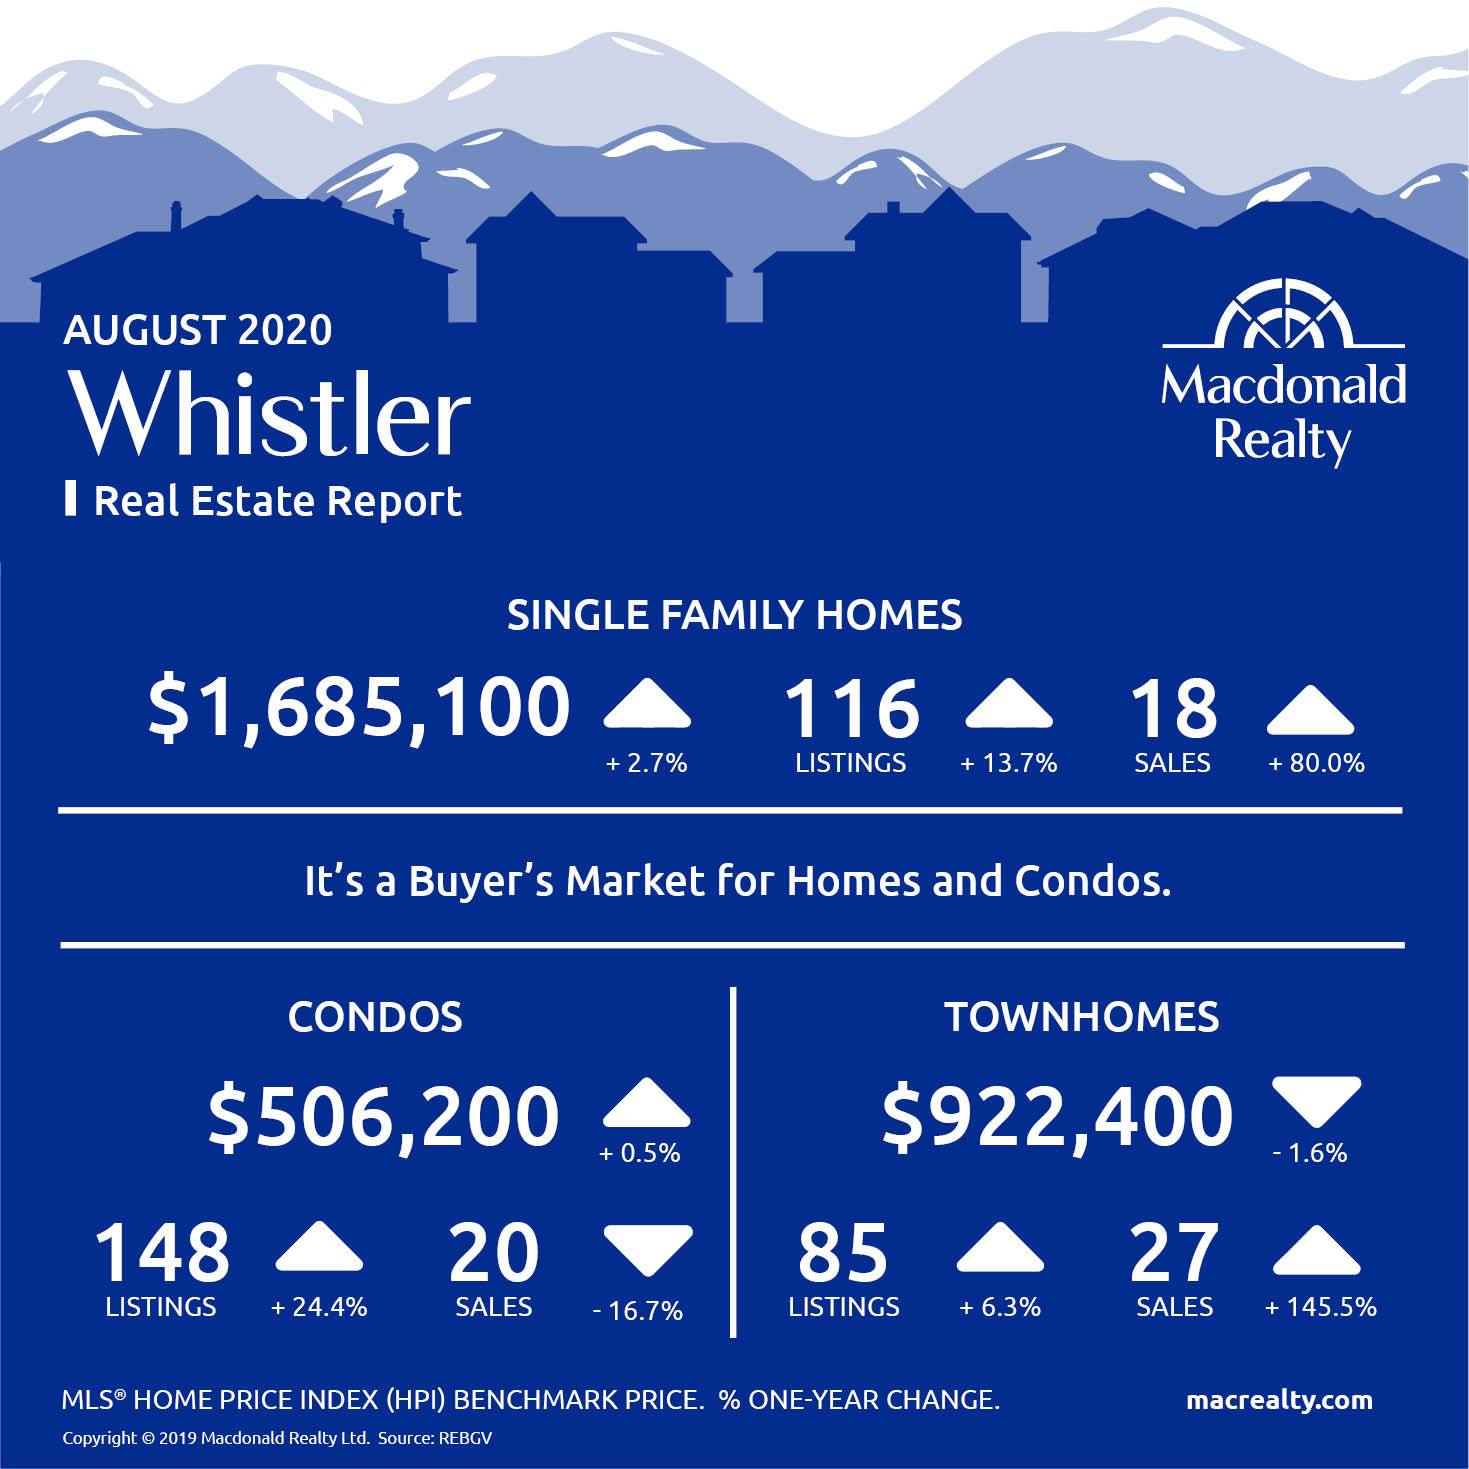
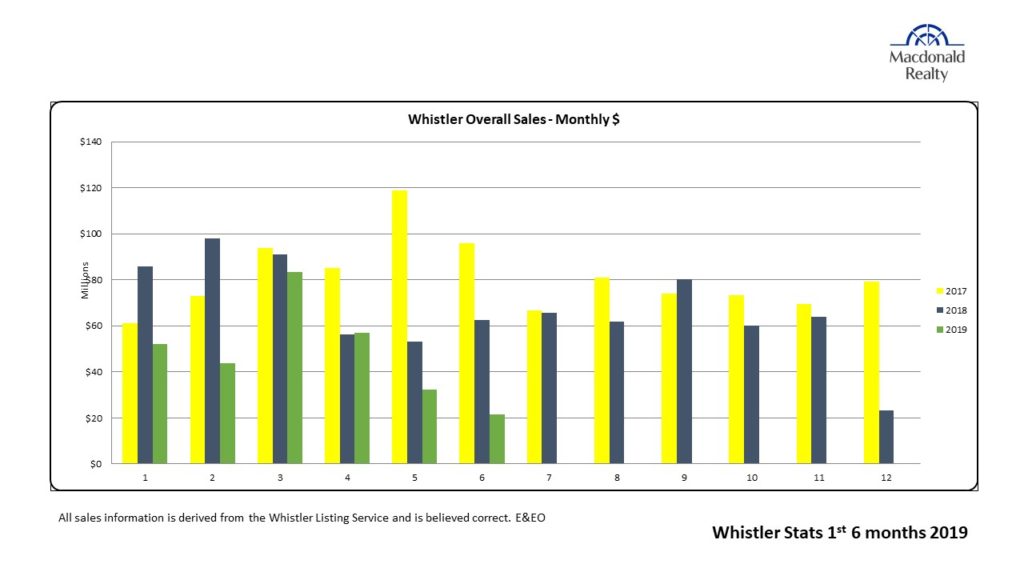
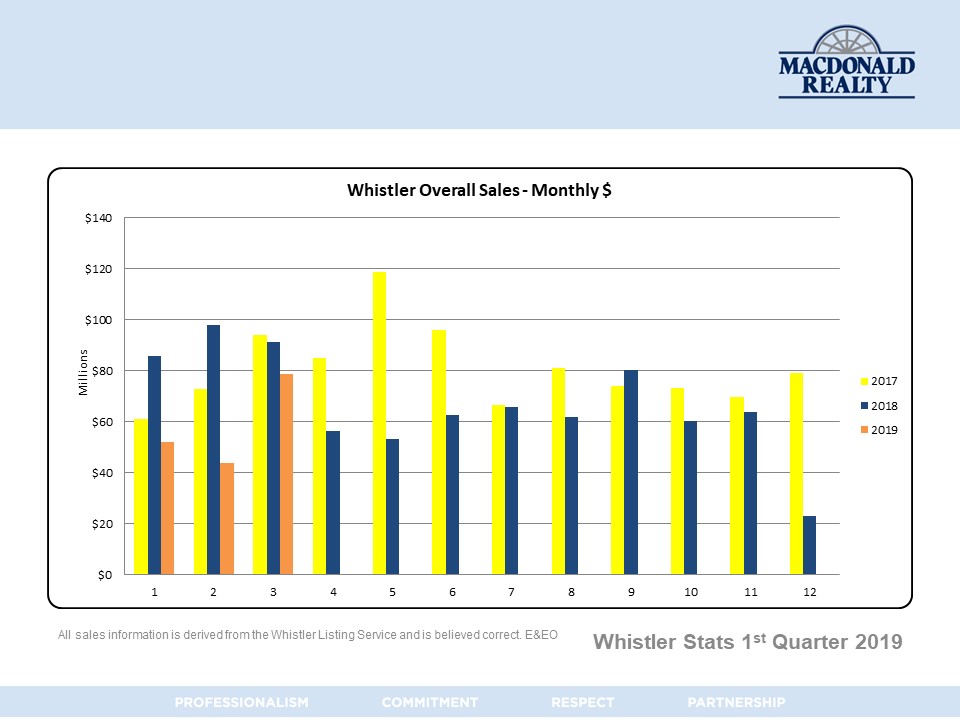
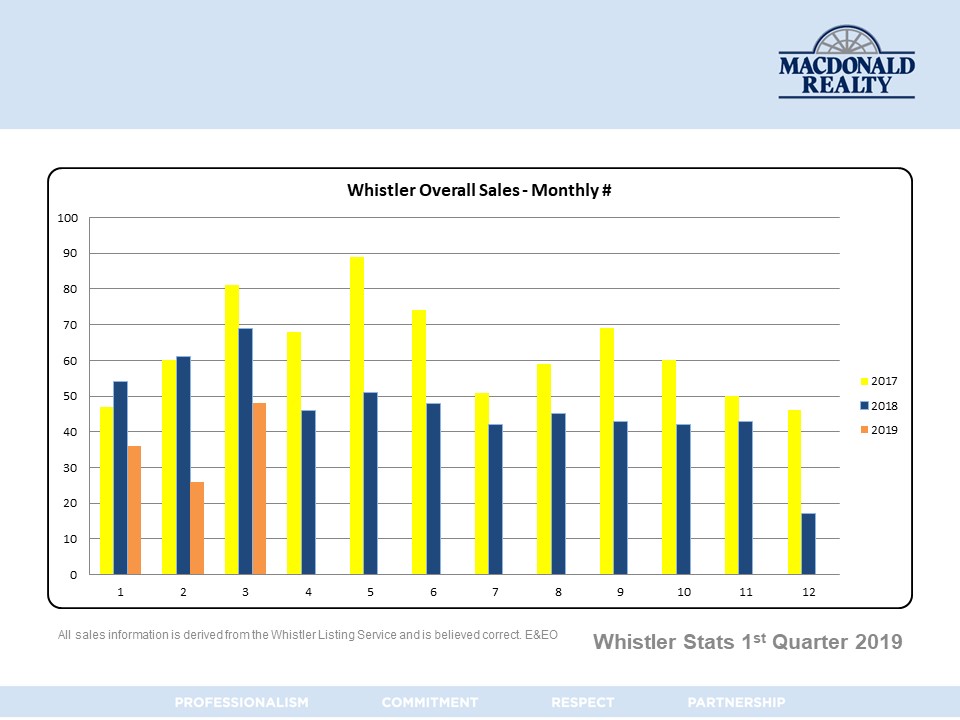
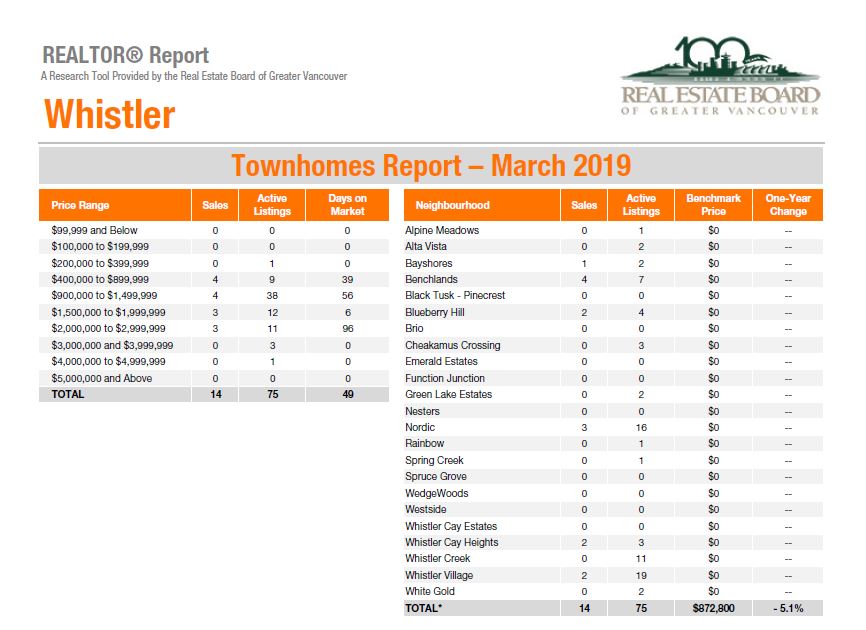
According to the Whistler Real Estate Company’s 2025 year-end market report, overall Whistler unit sales were down 6% compared to 2024, while total dollar volume was only down 1%. That small difference is important because it shows that higher-value property types, especially chalets and townhomes, helped support the overall market.
For buyers and sellers, the key takeaway is this: Whistler remained resilient, but the market was not moving evenly across every property type.
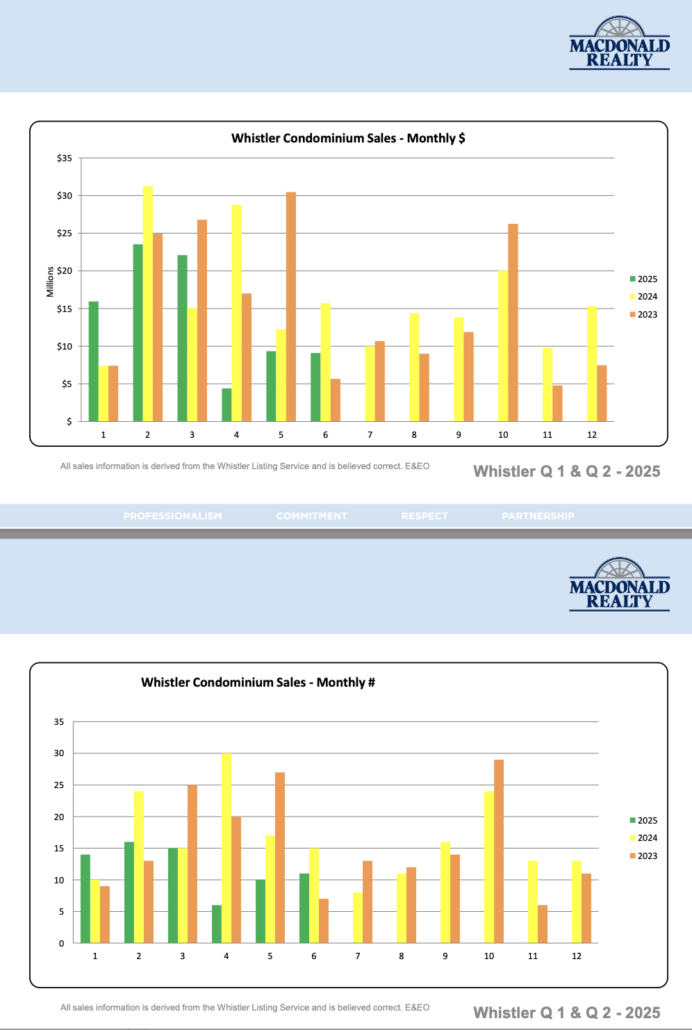
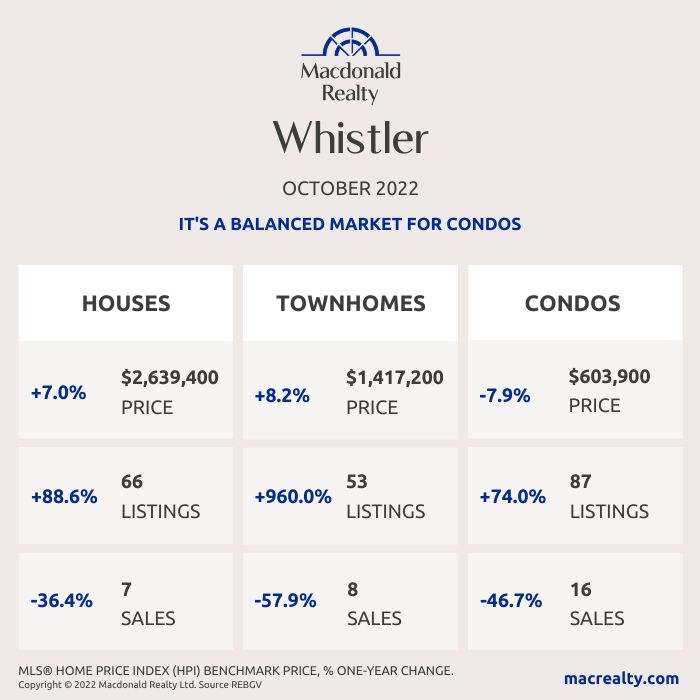
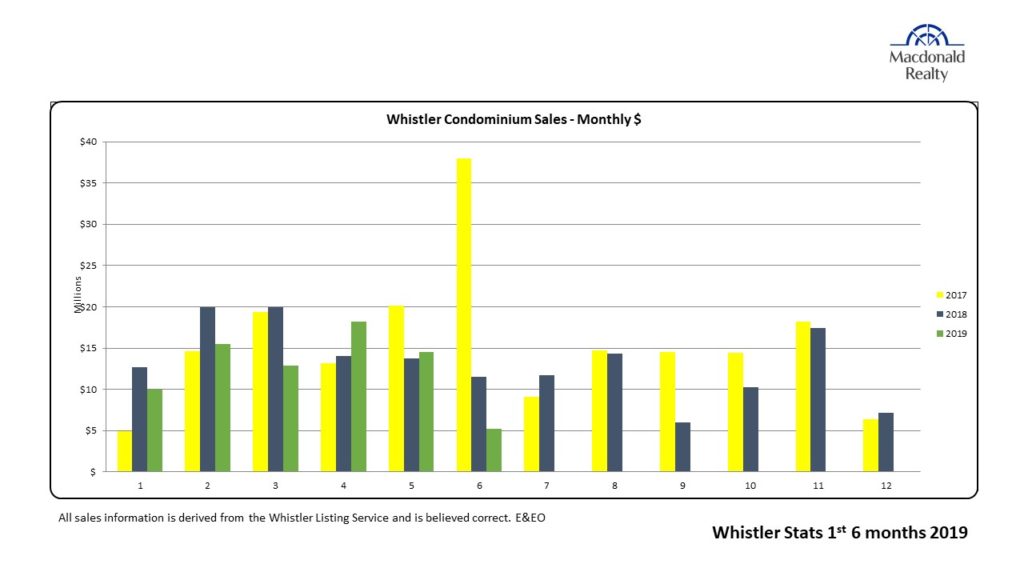
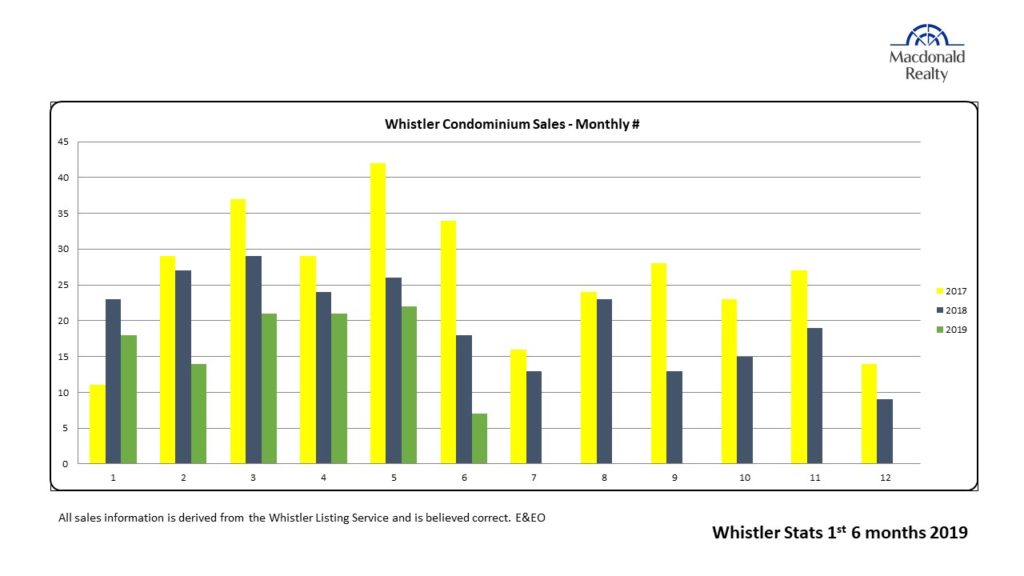
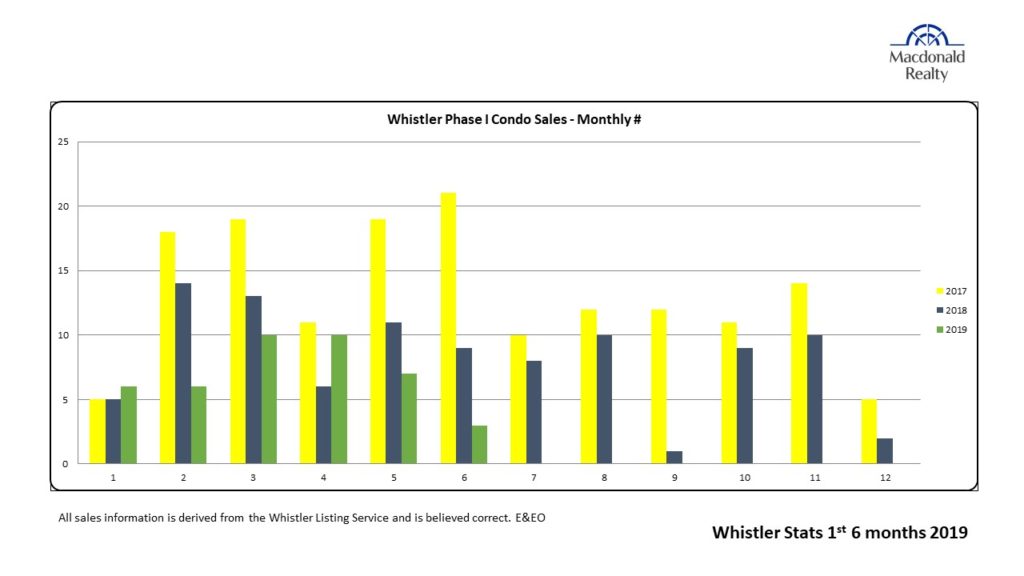
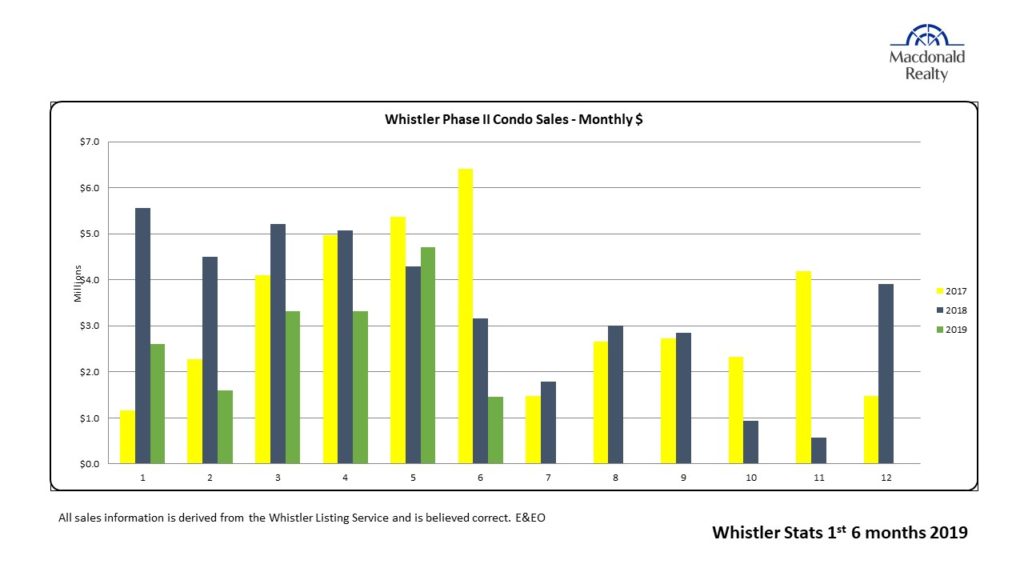
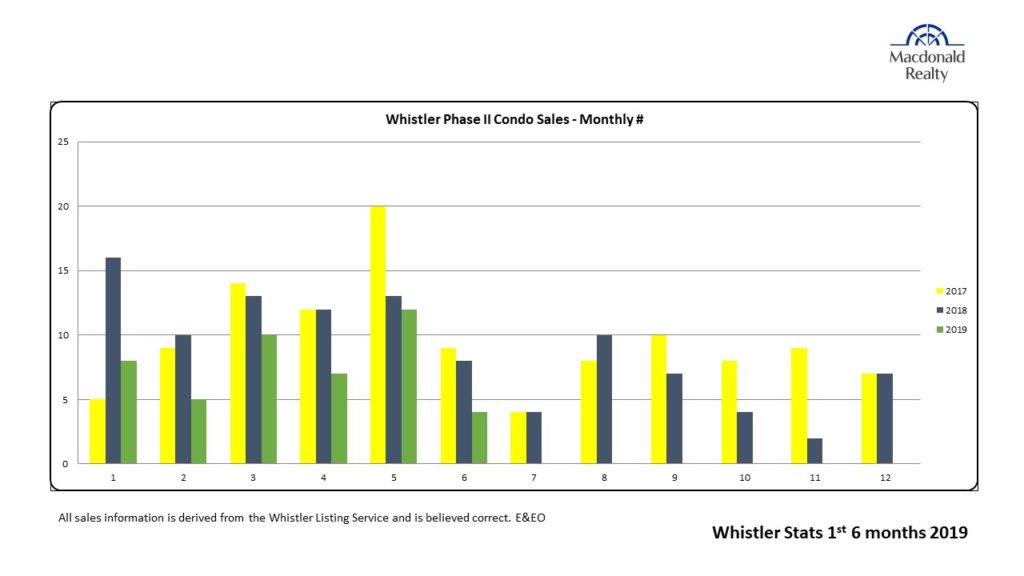
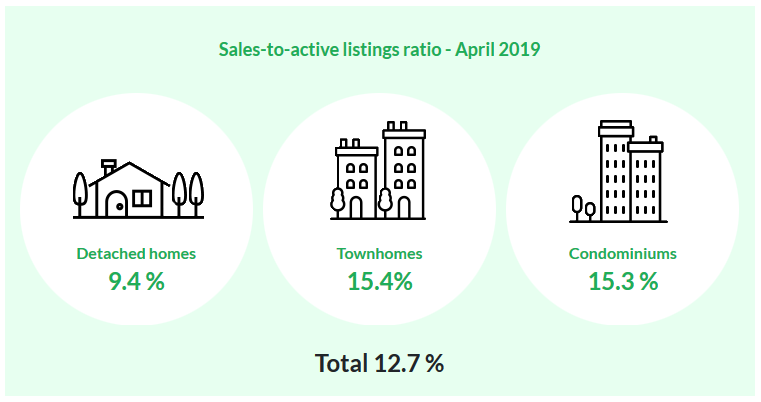
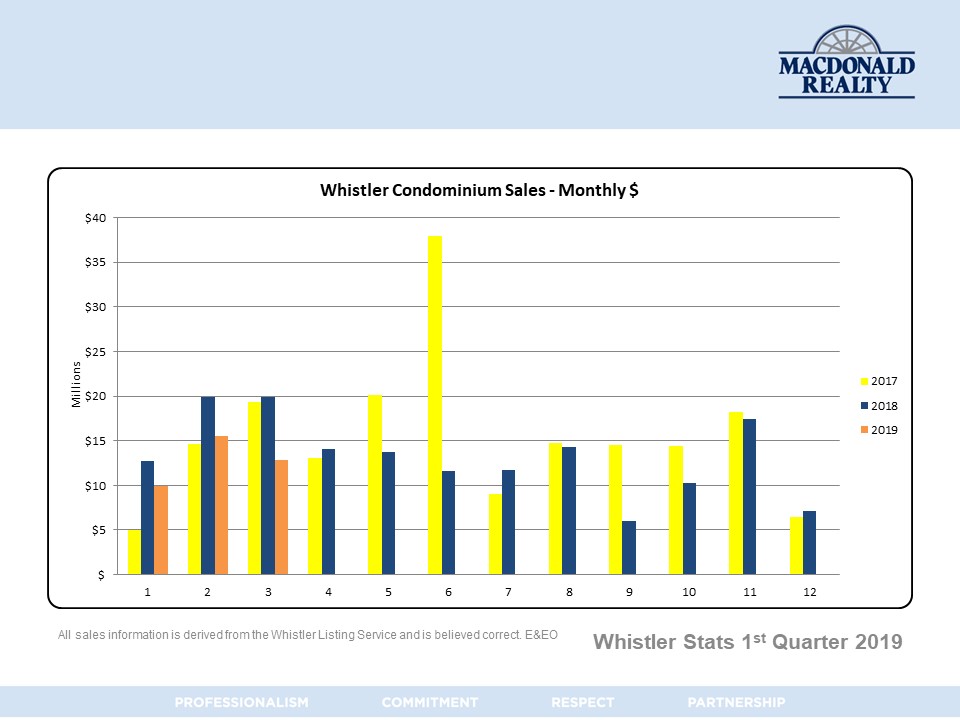
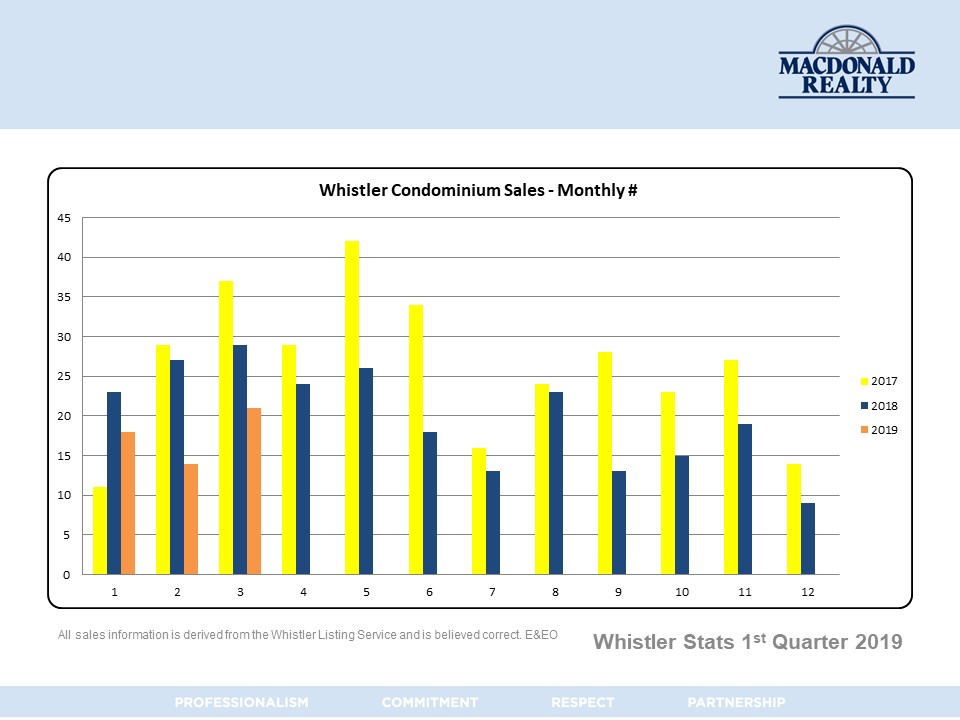
Condos Saw the Biggest Shift
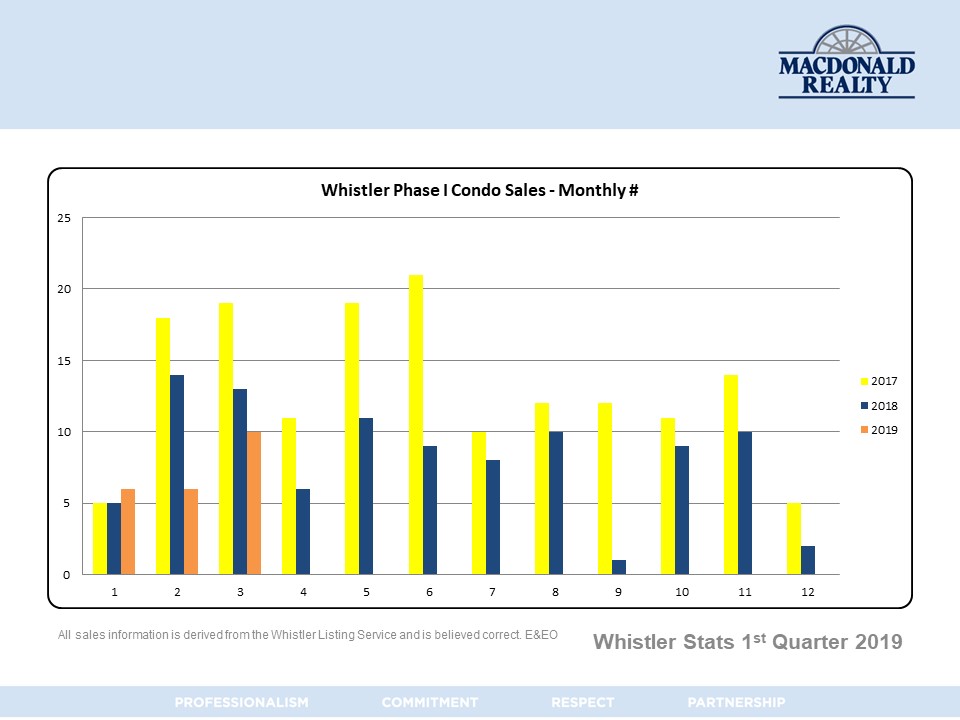
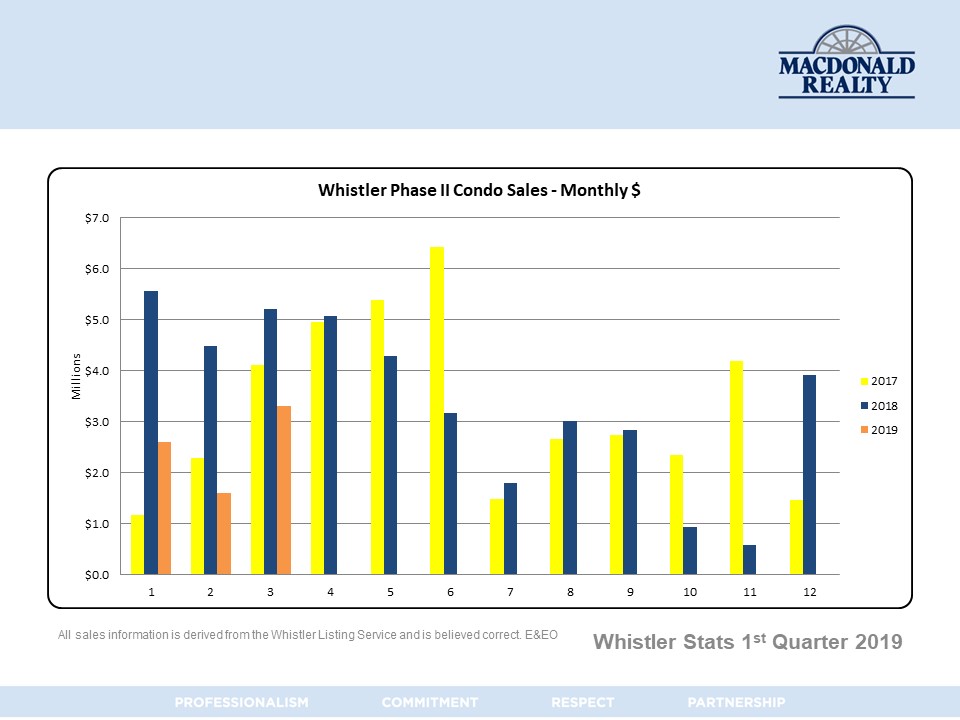
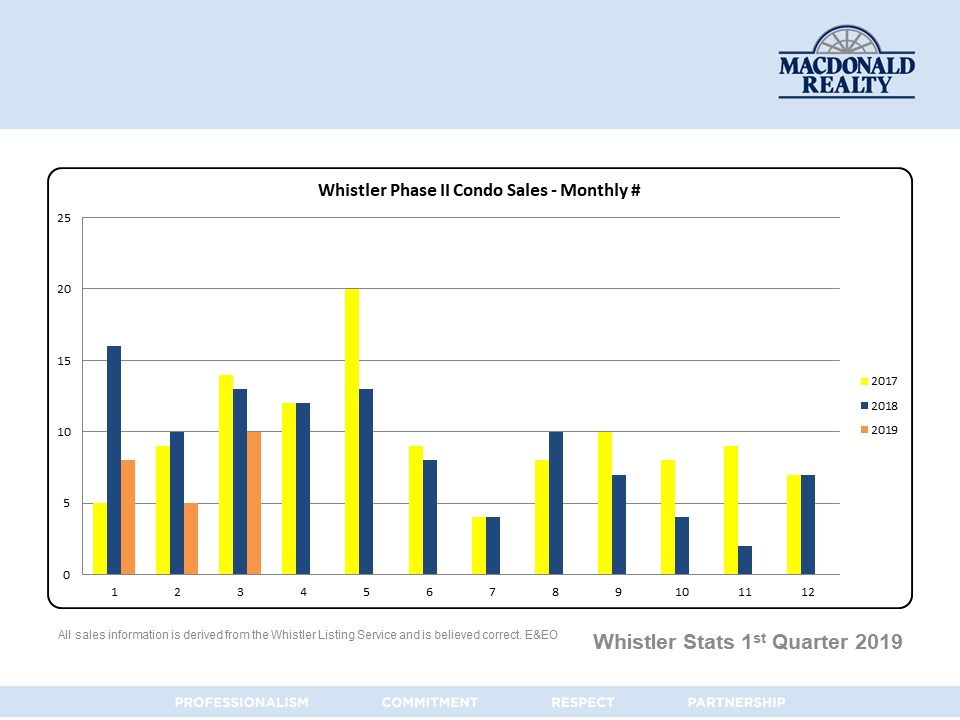
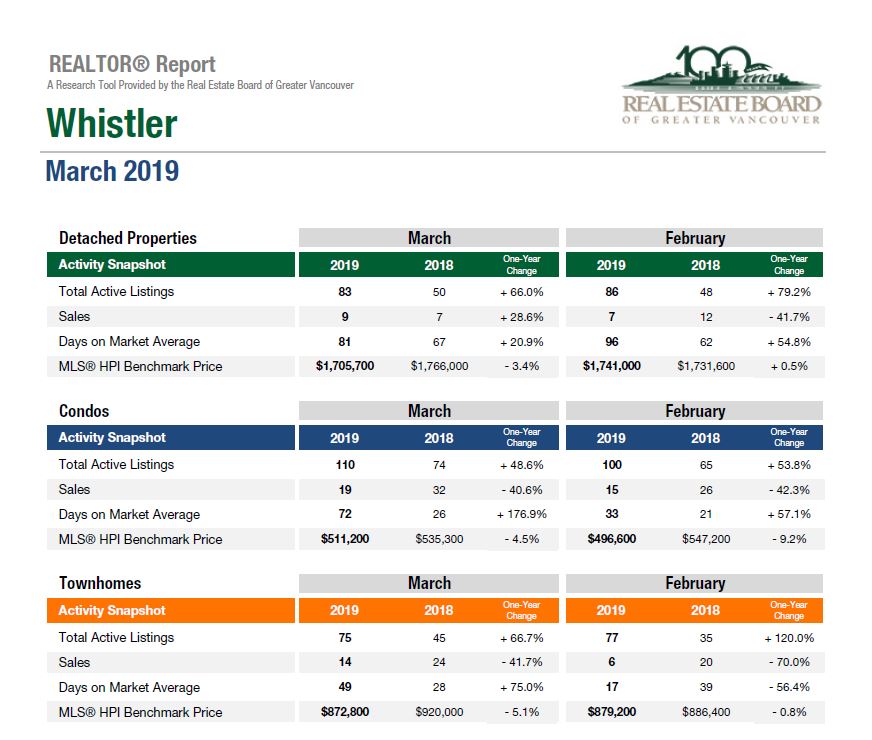
The condominium segment experienced the most noticeable slowdown in 2025.
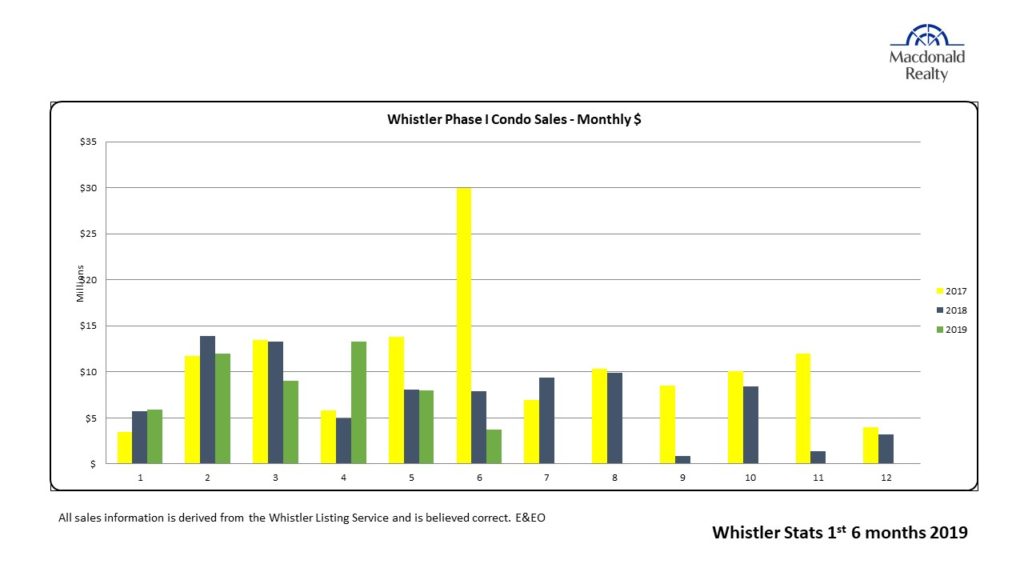
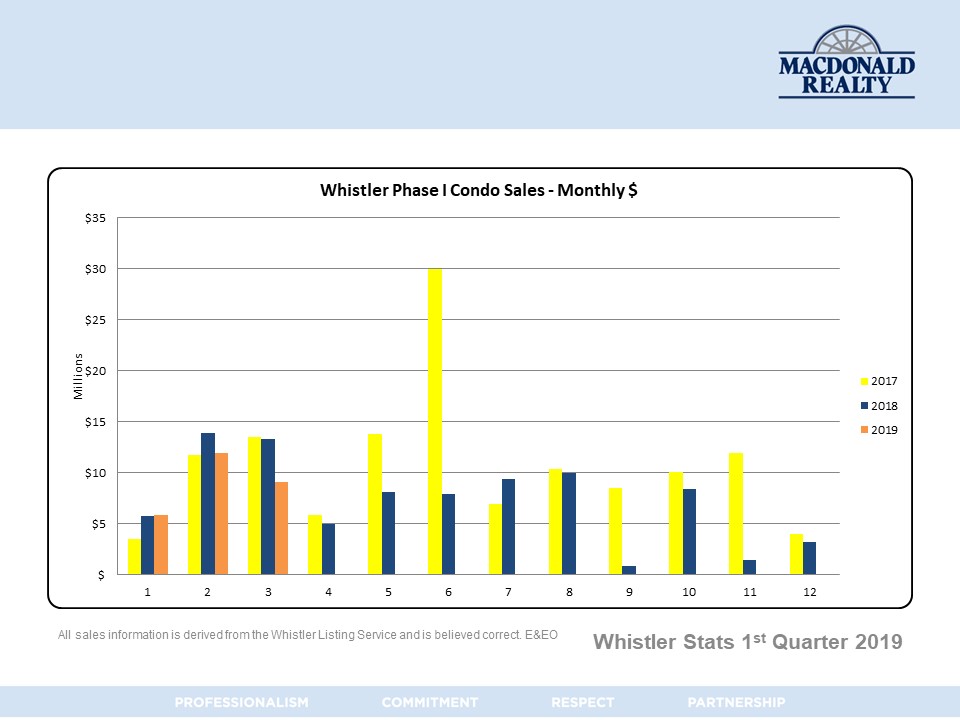
Condo unit sales were down 17% year over year, while condo dollar volume decreased by 12%.
This does not mean condos are no longer in demand. Whistler condos continue to be one of the most searched and accessible entry points into the market, especially for buyers looking for personal use, rental income potential, or a long-term foothold in Whistler.
However, buyers in this segment were more cautious in 2025. With higher borrowing costs, more choice in some areas, and careful attention to strata fees, rental zoning, phase restrictions, and building condition, condo buyers took their time.
For sellers, this means pricing, presentation, and clear communication around ownership rules became even more important.
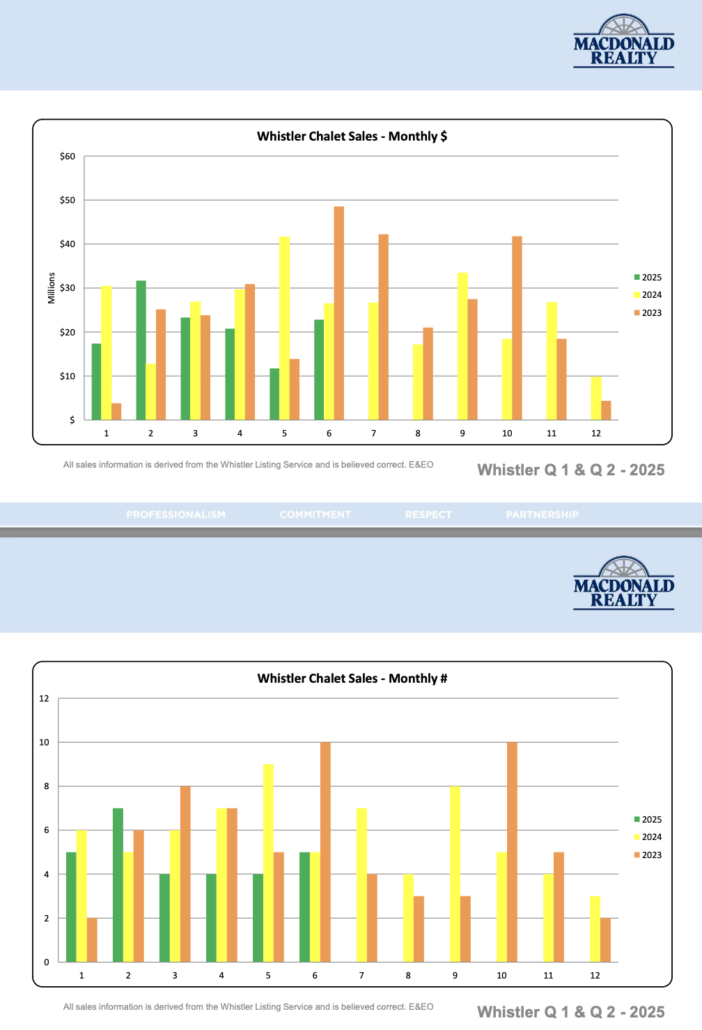
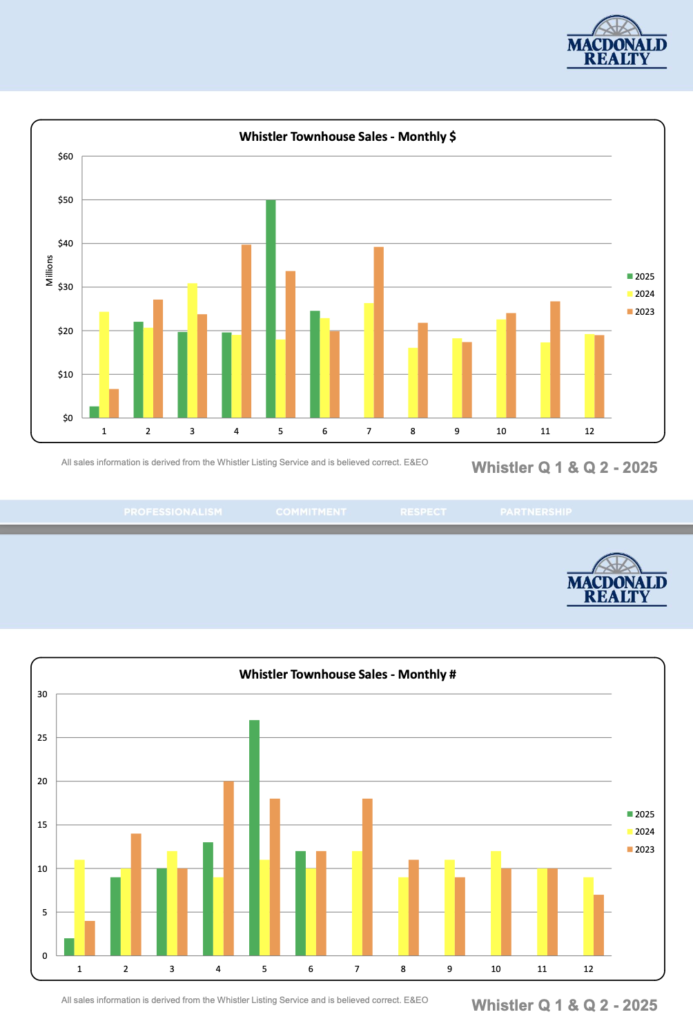
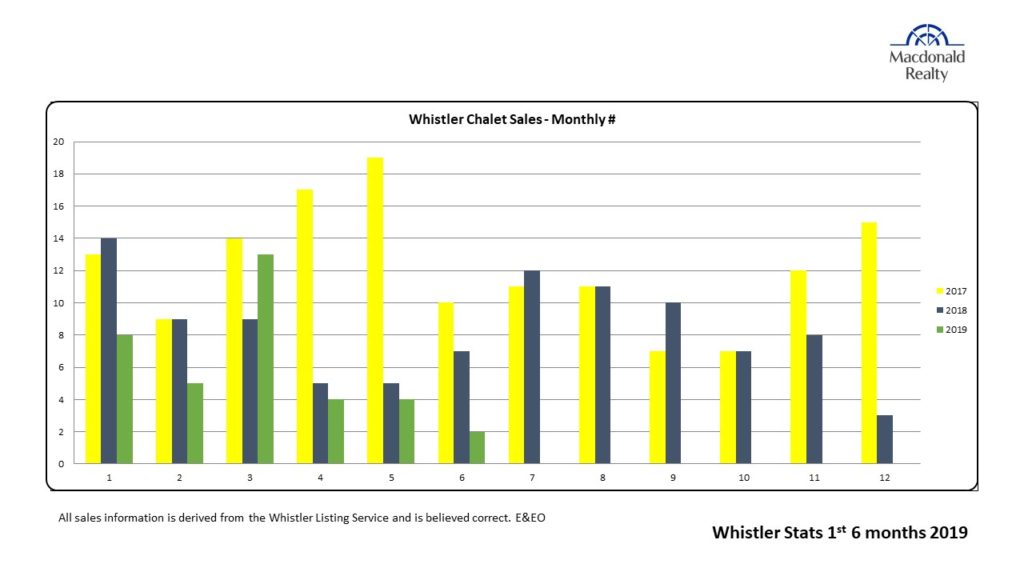
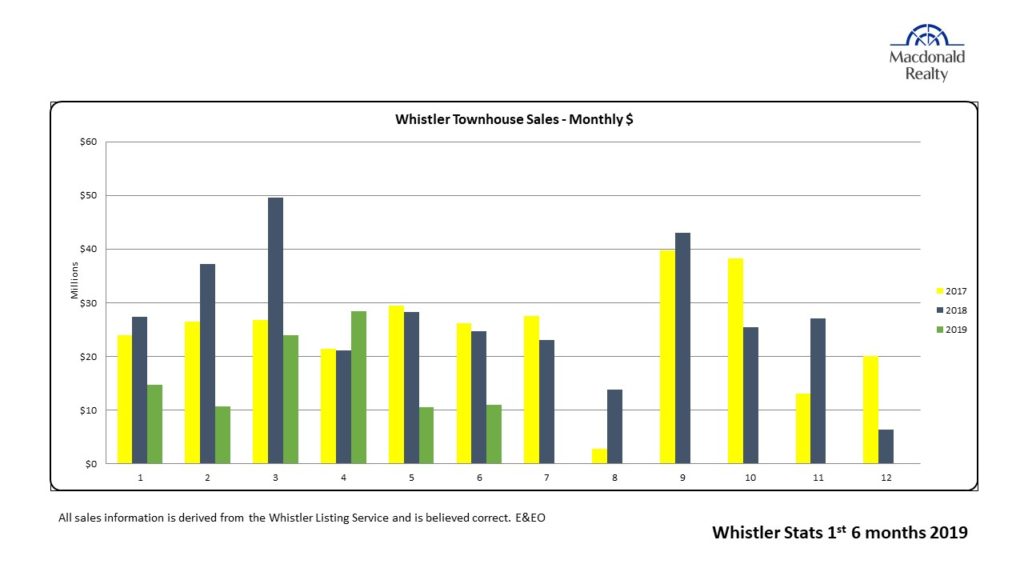
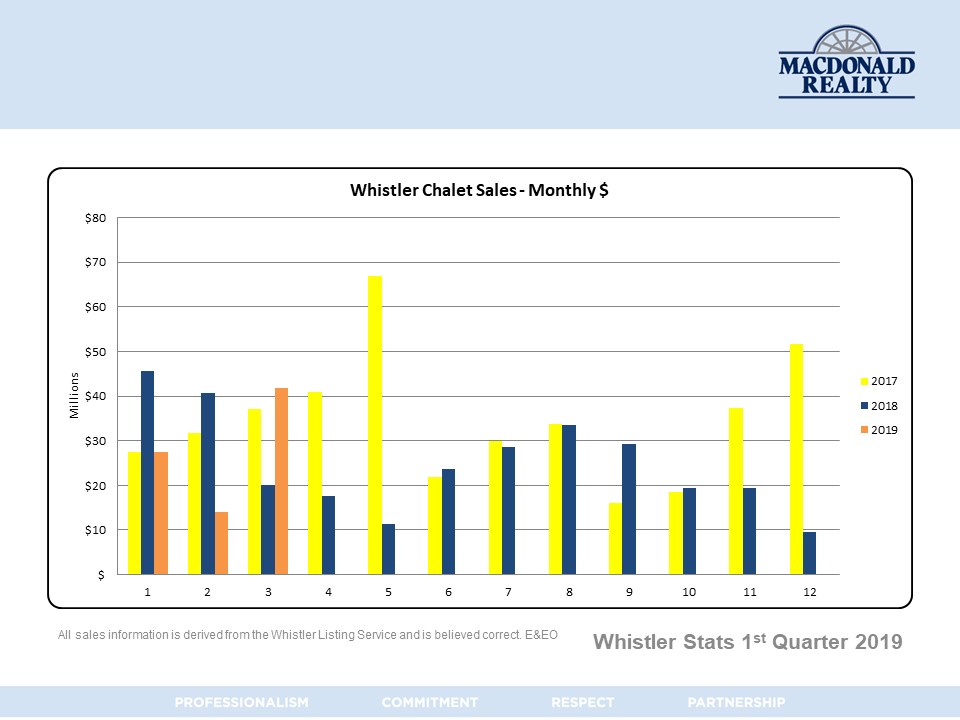
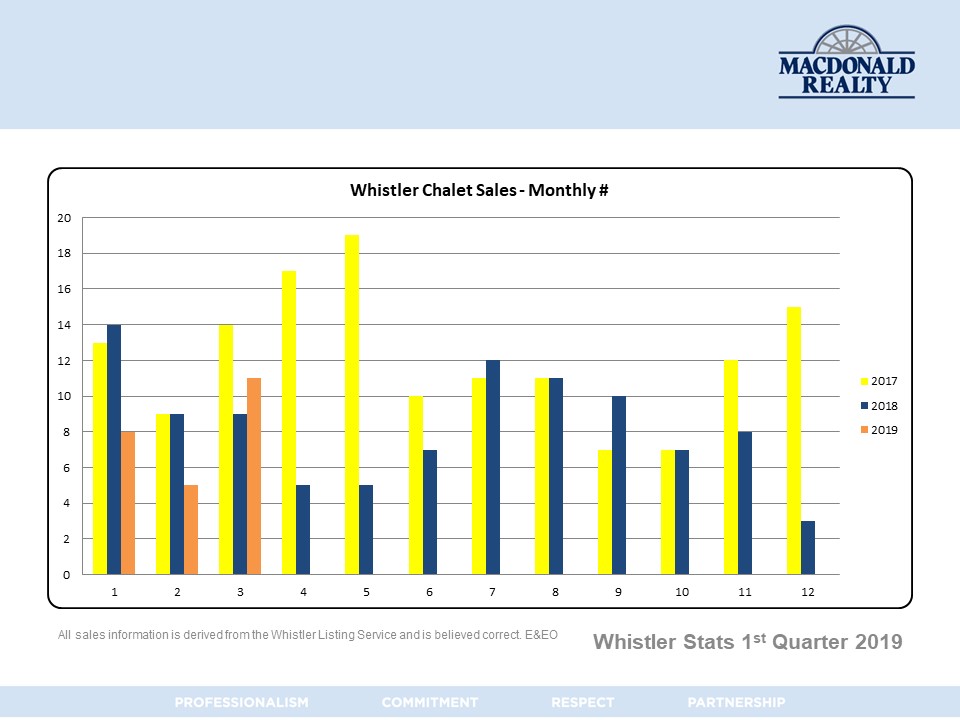
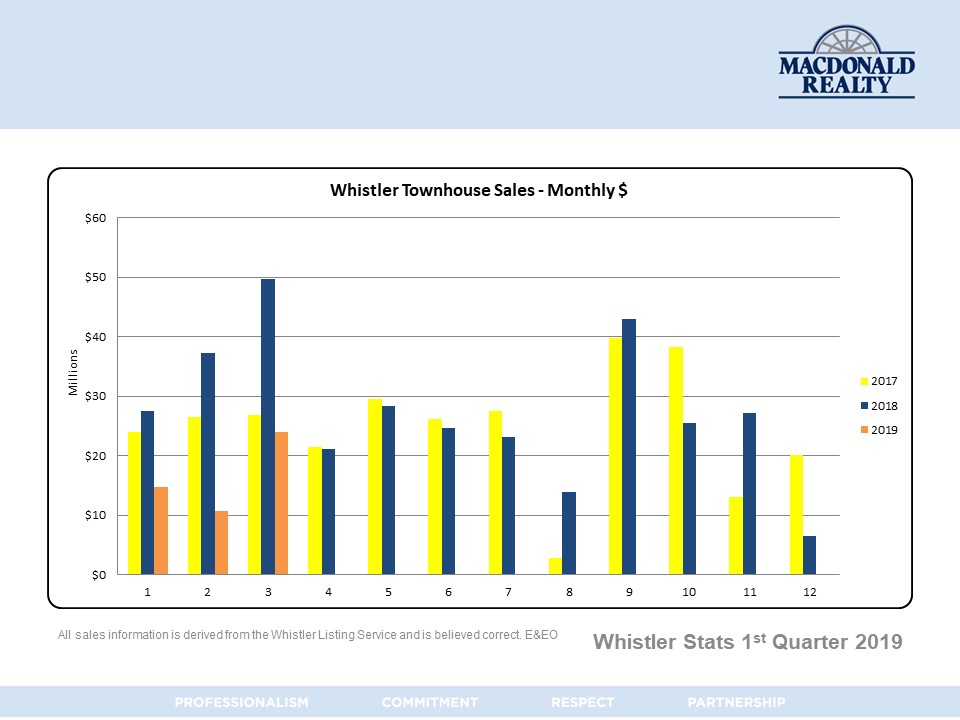
Chalets and Townhomes Showed Strength
While condos softened, the chalet and townhome markets told a different story.
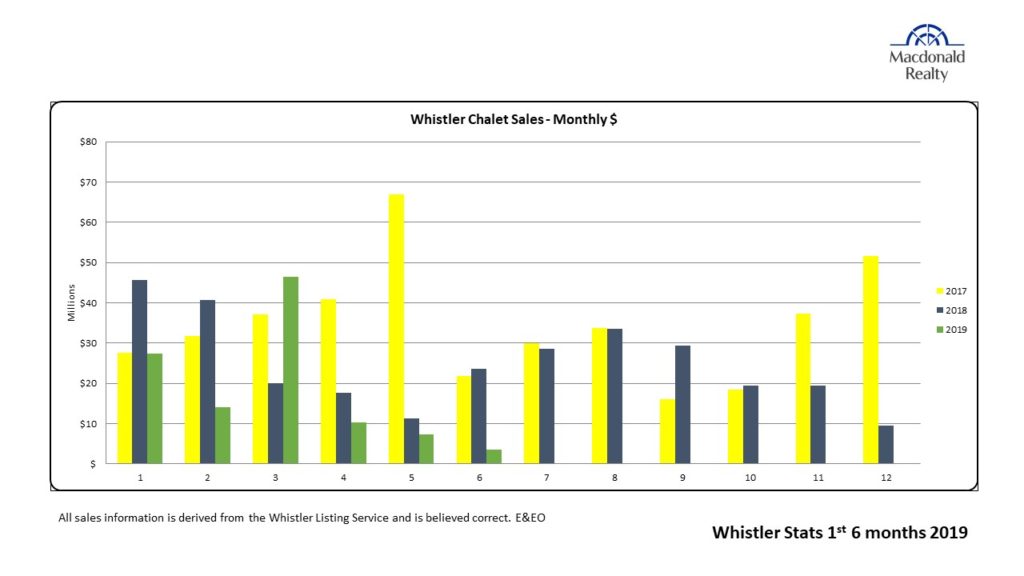
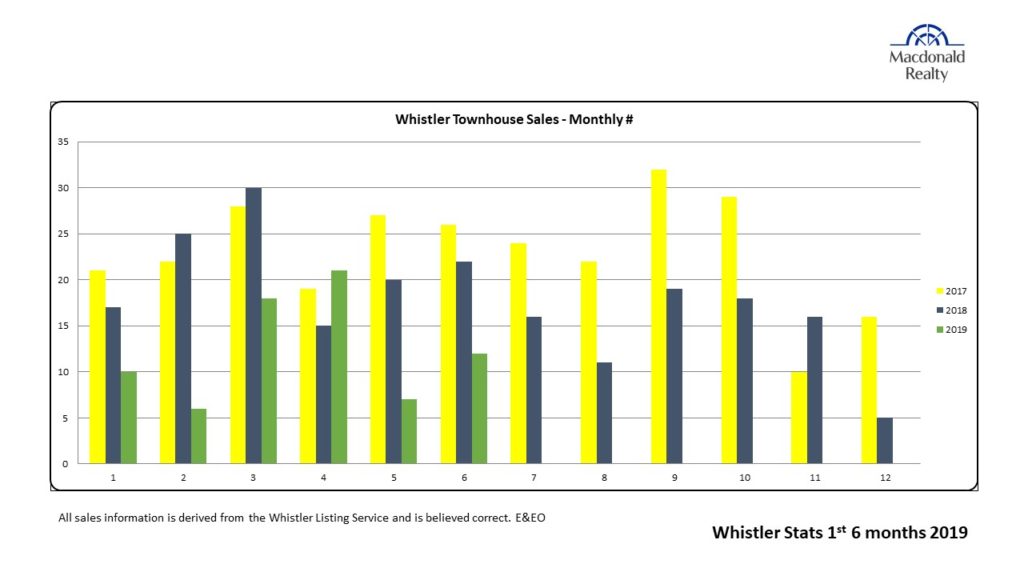
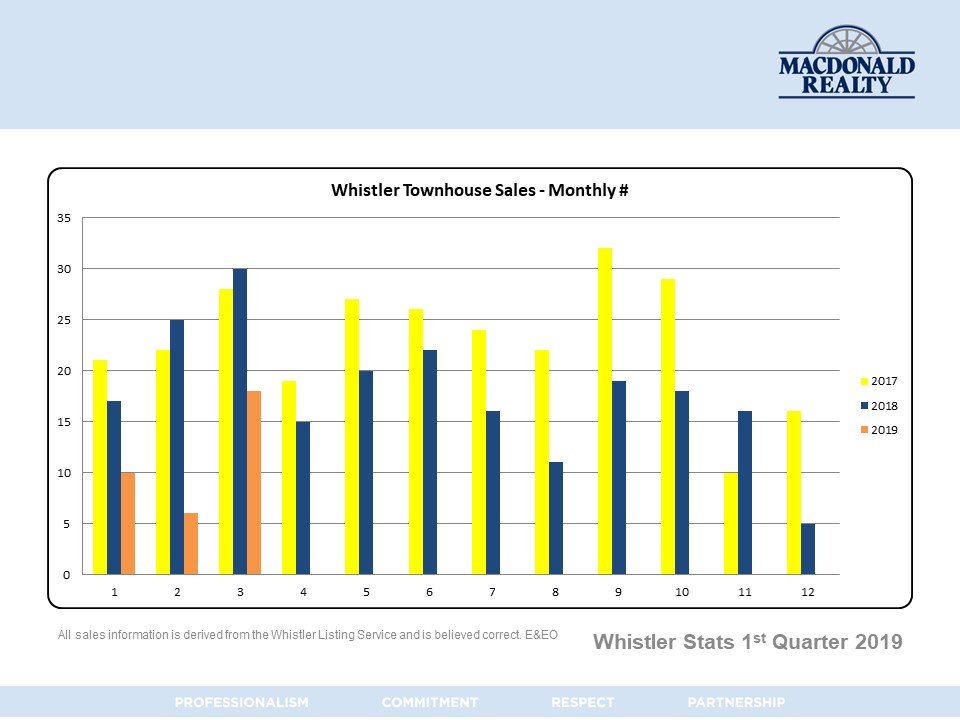
Chalet sales increased by 7% in units and 11% in dollar volume, while townhouse sales rose by 15% in units and 9% in dollar volume.
This suggests that buyers were still willing to move forward when they found the right lifestyle property.
In Whistler, townhomes and chalets often appeal to buyers looking for more space, privacy, parking, storage, and flexibility for family and guests. These are not always impulse purchases. They are often long-term lifestyle decisions.
That is one of the reasons Whistler remains such a unique market. People are not just buying square footage here. They are buying access to the mountains, the trails, the lakes, the village, and the lifestyle that comes with it.
Buyers Were Selective, But Still Engaged
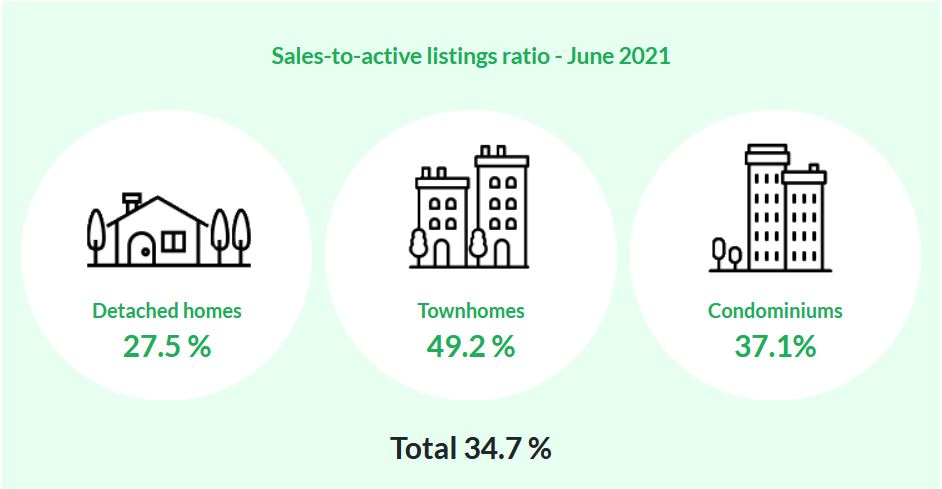
One of the most interesting numbers from the 2025 report is that 53% of new listings that came to market sold within the year. When condos and vacant land were removed from that calculation, the number rose to more than 60%.
To me, that says a lot.
It tells us that buyers were not gone. They were simply more selective.
Well-priced properties in desirable locations still attracted attention. Homes with strong presentation, clear value, and the right positioning continued to sell. On the other hand, properties that were overpriced or harder to understand often sat longer.
This is where local knowledge matters. In Whistler, two properties can look similar online but perform very differently depending on zoning, rental use, building rules, views, sun exposure, strata history, parking, storage, and location.
What This Means for Sellers
If you are thinking about selling in Whistler, 2025 showed us that the market still rewards good strategy.
Sellers should not assume that every listing will move quickly, but they also should not feel discouraged by softer headline numbers. The right property, positioned well, can still perform strongly.
A successful selling strategy in today’s market should include:
- Accurate pricing based on current buyer behaviour
- Professional presentation and strong photography
- Clear explanation of rental rules, zoning, and ownership structure
- A marketing plan that reaches both local and out-of-market buyers
- Patience, especially in property segments where buyers are taking longer to decide
In Whistler, details matter. Buyers often compare not only price, but lifestyle, convenience, income potential, and long-term value.
What This Means for Buyers
For buyers, the 2025 market created opportunity, especially for those who were prepared.
More balanced conditions can give buyers time to compare options, ask questions, and make thoughtful decisions. That is especially helpful in Whistler, where every building, neighbourhood, and ownership type can come with different rules.
Before buying, it is important to understand:
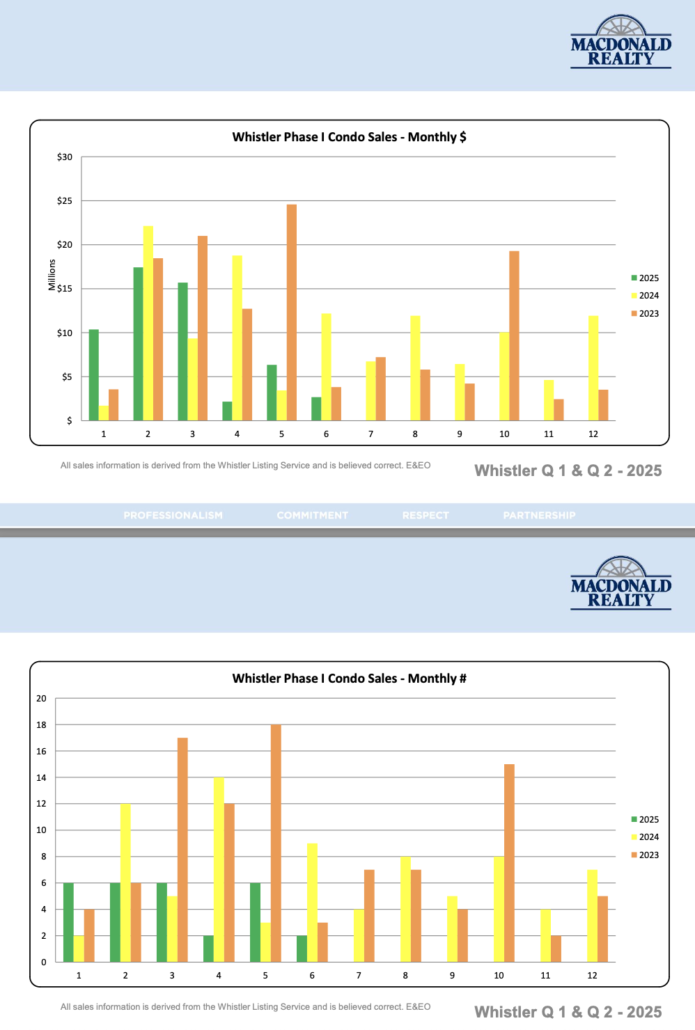
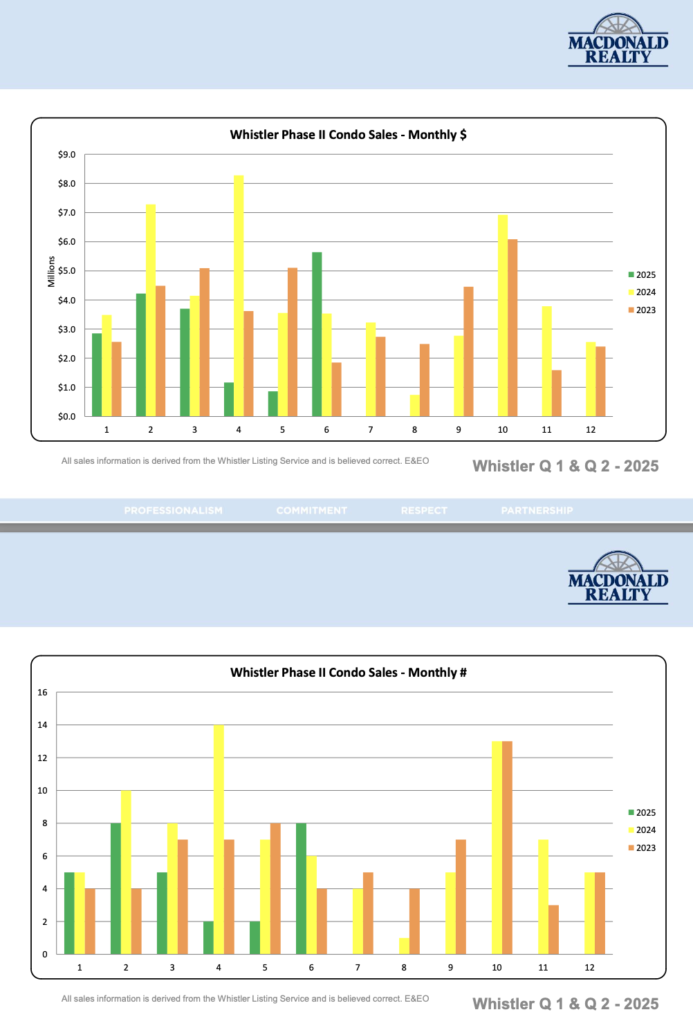
- Phase 1 vs Phase 2 ownership
- Nightly rental zoning
- Strata fees and building history
- GST implications
- Foreign buyer rules
- Financing options
- Long-term use and rental potential
The best opportunities are not always the cheapest listings. Often, the best opportunity is the property that truly fits your goals.
A Quick Note for U.S. and International Buyers
Whistler continues to be of interest to U.S. and international buyers, especially those looking for lifestyle, rental potential, or a long-term mountain property.
The federal foreign buyer ban applies to certain residential properties located in Census Metropolitan Areas and Census Agglomerations, according to CMHC. The Whistler Real Estate Company’s report notes that the ban does not apply to the Whistler and Pemberton markets.
That said, rules can be nuanced, and buyers should always confirm their specific situation with a lawyer and qualified real estate advisor before purchasing.
Important Regulatory Updates to Keep in Mind
There are also a few provincial rules that buyers and sellers should be aware of.
The BC Home Flipping Tax came into effect on January 1, 2025 and may apply to residential properties sold within 730 days of purchase, unless an exemption applies. The rate starts at 20% for sales within 365 days and gradually declines to 0% by day 730.
There have also been changes to tenancy rules in British Columbia. For certain landlord-use evictions, landlords must use the provincial web portal, and the Province currently outlines a three-month notice requirement for landlord occupancy.
These rules can affect timelines, negotiations, and closing strategy, especially if a property is tenant-occupied.
Looking Ahead to 2026
As we move through 2026, interest rates, buyer confidence, inventory levels, and broader economic conditions will continue to shape the Whistler market.
The Bank of Canada held its policy rate at 2.25% on April 29, 2026, after holding the same rate earlier in the year.
For many buyers, more stability around borrowing costs can make planning easier. For sellers, it may help bring more qualified buyers back into the conversation.
In Whistler, demand is rarely driven by only one factor. Lifestyle, scarcity, zoning, rental potential, family use, and long-term confidence in the resort all play a role.
Final Thoughts
The 2025 Whistler market was not a dramatic boom or bust. It was a more thoughtful market.
Condos faced more pressure, while chalets and townhomes showed strength. Buyers were selective, but active. Sellers who priced and presented well still found success.
Whether you are thinking about buying, selling, or simply trying to understand where the Whistler market is heading, the most important thing is to look beyond the headlines and understand how the numbers apply to your specific property or goals.
If you have questions about the Whistler real estate market, current listings, or what your property may be worth in today’s conditions, I would be happy to help.
Considering a move in Whistler? Reach out anytime – I’d love to talk through your options.