In a recent interview with the Real Estate Board of Greater Vancouver, Director of Economics and Data Analytics, Andrew Lis said the following:
I think most people would focus on average (or median) prices and sales volumes. We certainly see lots of discussion about it in the media.
But from my experience, I could probably tell you what’s happening to both prices and sales (and other indicators) by simply knowing the current and historical values of one single indicator: inventory.
If you look at real estate data for long enough, you’ll find that the one data series that contains a considerable amount of ‘predictive power’ is inventory. Low inventory scenarios are typically brought about by strong demand, which is typically synonymous with high sales volumes. Under these scenarios, prices tend to rise – sometimes dramatically, as we’ve seen in recent years.
The converse of this is generally true as well, with the caveat that prices tend to be much more ‘sticky’ downward than they are upward. But by knowing how much inventory there is online at any given time relative to the past, one can infer quite a lot about the current state of the market.
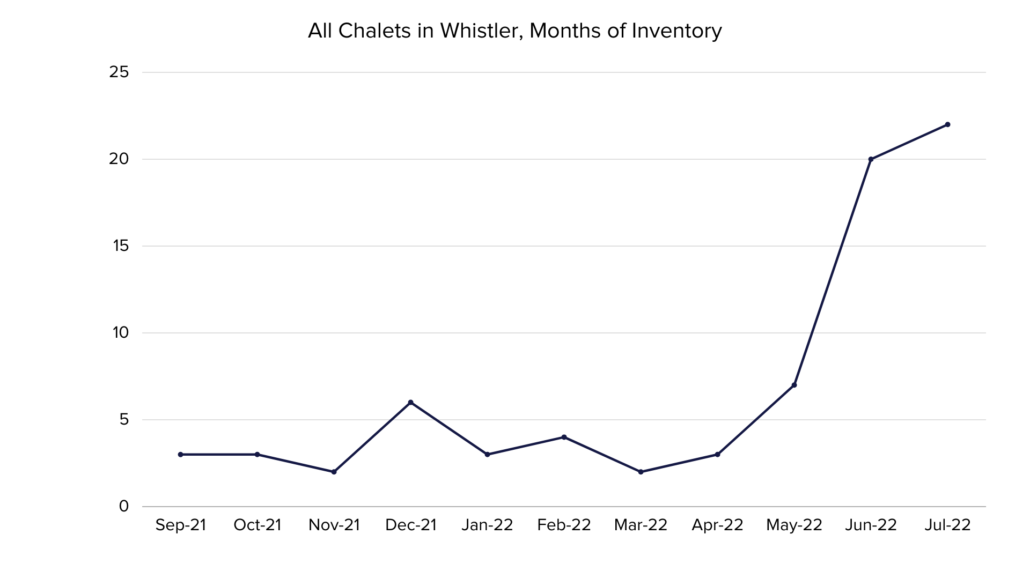
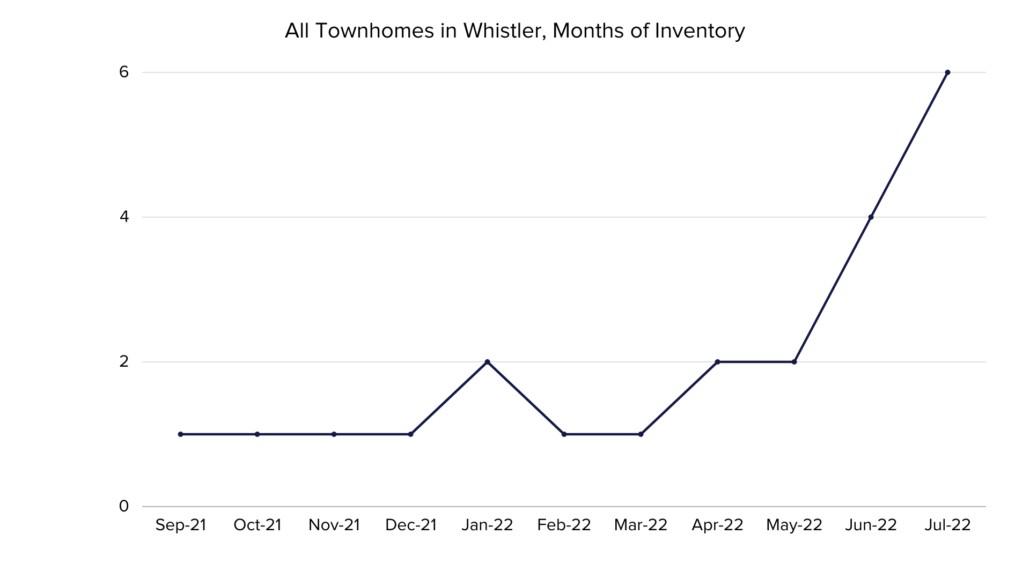
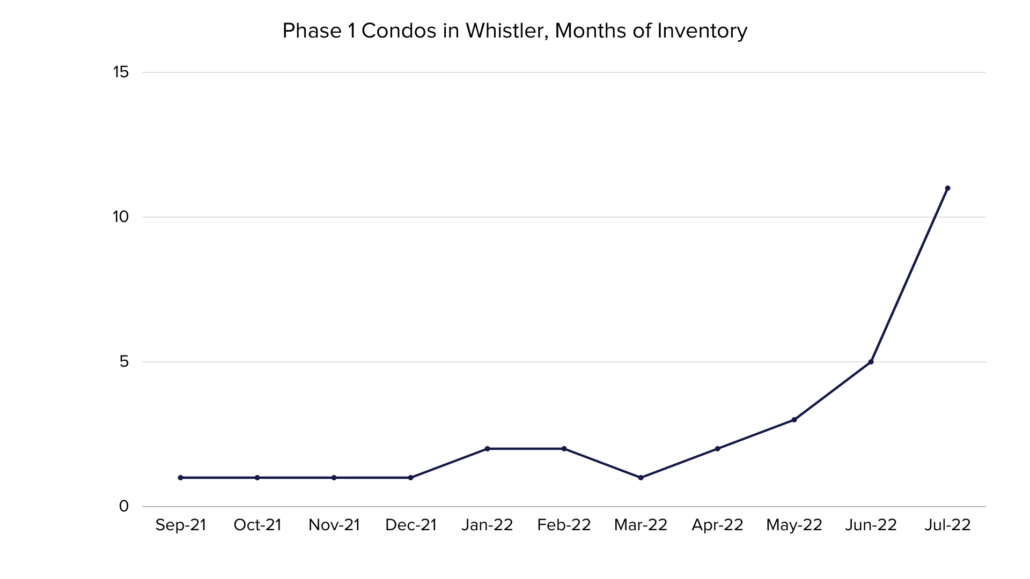
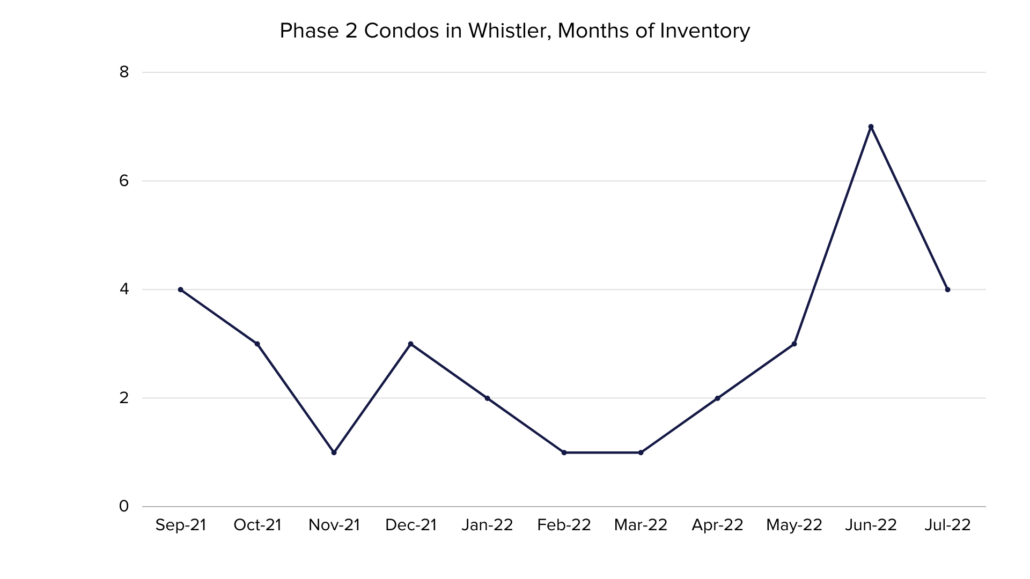
With that in mind, below are some graphs showing the Months of Inventory development in various market segments.
The most reliable indicator of market prices is the Sales to Active Listings Ratio (SAL). This is the ratio between the number of sales in a given month and the number of active listings at month-end. In hotter markets in BC, a long-term analysis has shown that prices will usually act in the following ways:
7+ Months of Inventory (Under 14% SAL): Prices will likely DECLINE
5 – 7 Months of Inventory (14% – 18% SAL): Prices will likely be STABLE
Less than 5.5 Months of Inventory (Over 18% SAL): Prices will likely RISE


