In a recent interview with the Real Estate Board of Greater Vancouver, Director of Economics and Data Analytics, Andrew Lis said the following:
I think most people would focus on average (or median) prices and sales volumes. We certainly see lots of discussion about it in the media.
But from my experience, I could probably tell you what’s happening to both prices and sales (and other indicators) by simply knowing the current and historical values of one single indicator: inventory.
If you look at real estate data for long enough, you’ll find that the one data series that contains a considerable amount of ‘predictive power’ is inventory. Low inventory scenarios are typically brought about by strong demand, which is typically synonymous with high sales volumes. Under these scenarios, prices tend to rise – sometimes dramatically, as we’ve seen in recent years.
The converse of this is generally true as well, with the caveat that prices tend to be much more ‘sticky’ downward than they are upward. But by knowing how much inventory there is online at any given time relative to the past, one can infer quite a lot about the current state of the market.
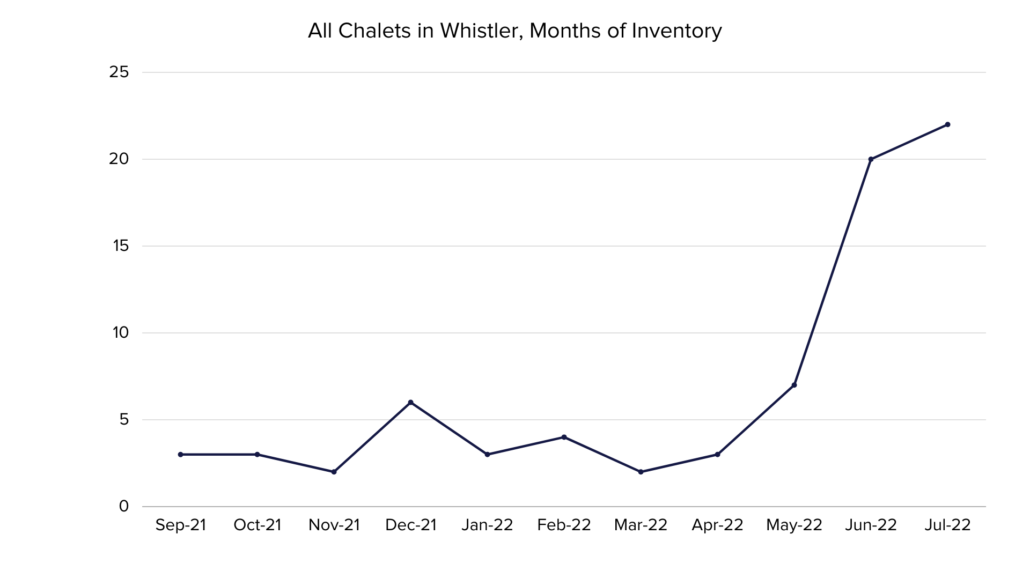
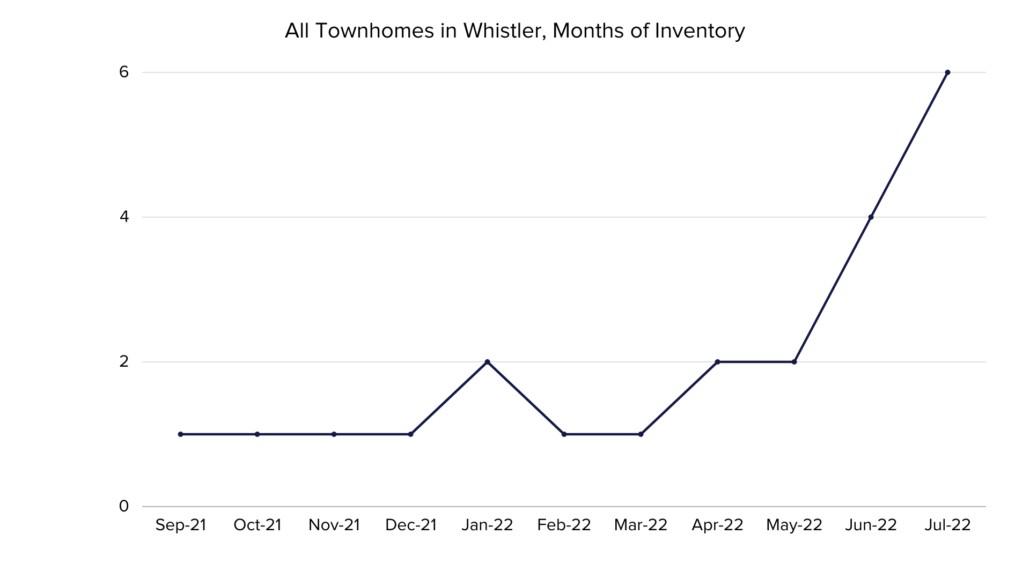
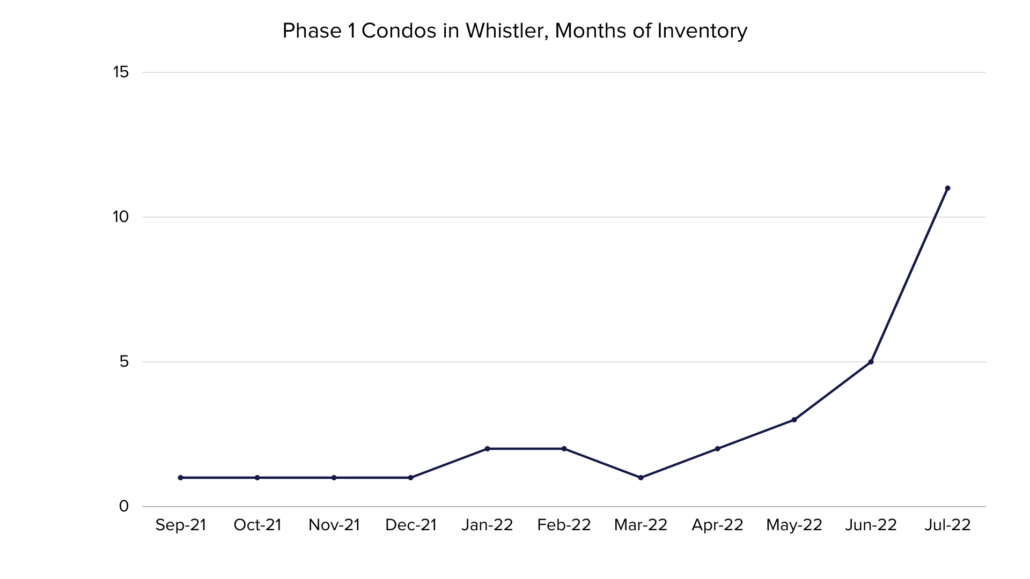
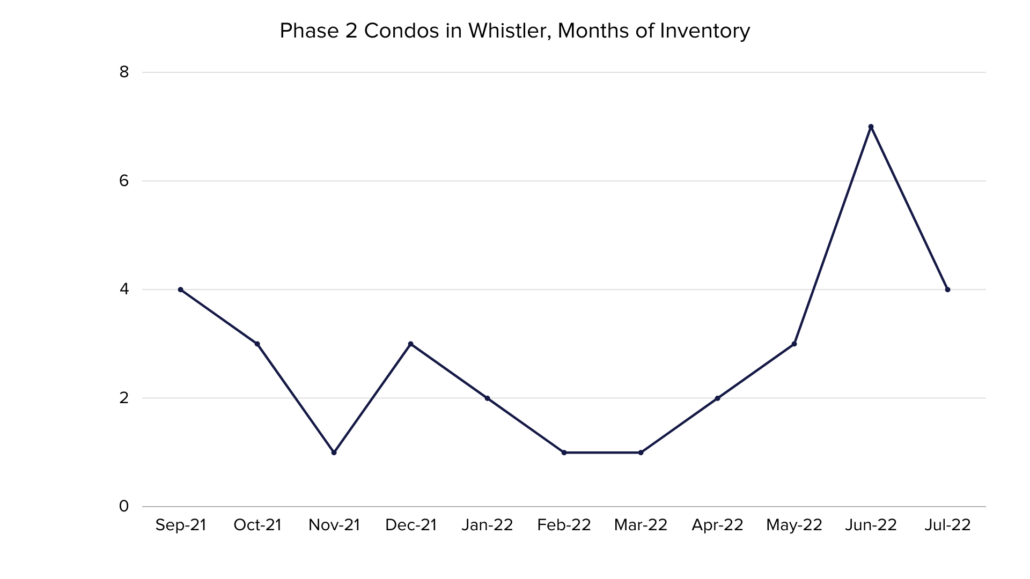
With that in mind, below are some graphs showing the Months of Inventory development in various market segments.
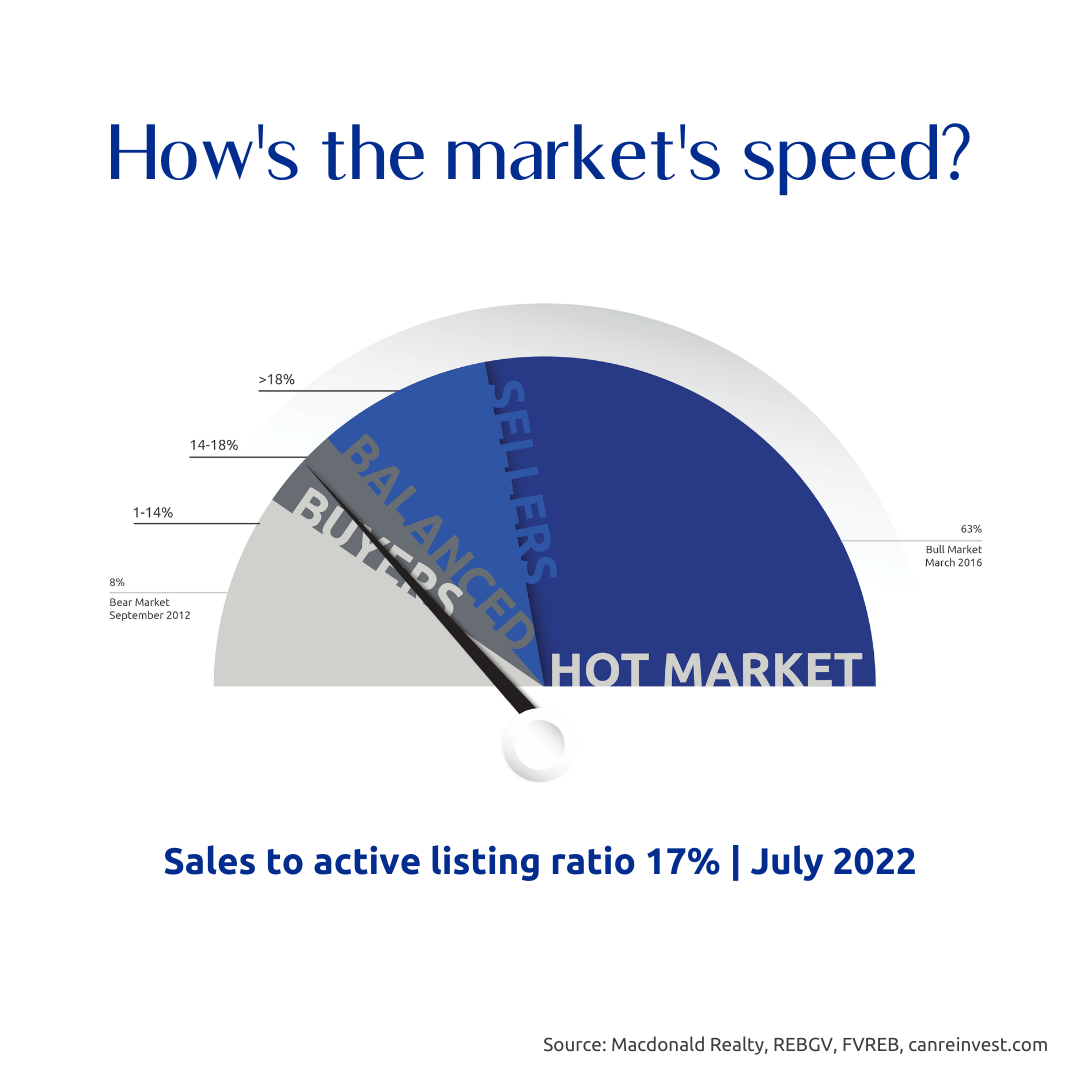
The most reliable indicator of market prices is the Sales to Active Listings Ratio (SAL). This is the ratio between the number of sales in a given month and the number of active listings at month-end. In hotter markets in BC, a long-term analysis has shown that prices will usually act in the following ways:
7+ Months of Inventory (Under 14% SAL): Prices will likely DECLINE
5 – 7 Months of Inventory (14% – 18% SAL): Prices will likely be STABLE
Less than 5.5 Months of Inventory (Over 18% SAL): Prices will likely RISE

Three questions with Andrew Lis | Director of Economics and Data Analytics
REBGV’s new Director of Economics and Data Analytics, Andrew Lis, joined REBGV in July. He’s an applied economist and data scientist specializing in real estate and urban land economics.
We asked Andrew three questions to help you get to know him better and preview some of the things he’ll be working on at the Board. Here’s what he told us.
What interests you about economics and analyzing economic data?
The stories behind the numbers.
Many people think data provides immutable answers to questions, and in some cases that’s true. But data doesn’t just exist in the world as if borne from thin air. Behind every data point is a data-generating process, and behind that, is a story.
So, for me, the fun in what I do is in painting compelling and engaging pictures of what the world around us looks like, by uncovering the stories behind the data.
In your opinion, what economic indicators are the most telling about what’s happening in the real estate market?
I think most people would focus on average (or median) prices and sales volumes. We certainly see lots of discussion about it in the media.
But from my experience, I could probably tell you what’s happening to both prices and sales (and other indicators) by simply knowing the current and historical values of one single indicator: inventory.
If you look at real estate data for long enough, you’ll find that the one data series that contains a considerable amount of ‘predictive power’ is inventory. Low inventory scenarios are typically brought about by strong demand, which is typically synonymous with high sales volumes. Under these scenarios, prices tend to rise – sometimes dramatically, as we’ve seen in recent years.
The converse of this is generally true as well, with the caveat that prices tend to be much more ‘sticky’ downward than they are upward. But by knowing how much inventory there is online at any given time relative to the past, one can infer quite a lot about the current state of the market.
What projects are you working on now?
There’s a ton of interesting projects already happening here at the Board that I’ve jumped into. Here’s a quick sampling:
• Getting up to speed with the Board’s strategic plan and other organizational policies.
• Reviewing and examining the previous economics and data-related work for ways to continue or expand upon it.
• Developing new communication strategies to share our data and findings with our members and the public.
• Building an Economics department at REBGV. This will be the bulk of my long-term work here and I have no shortage of ideas and directions!
I’m excited to join the Board and I really appreciate the support I’ve received from management, staff, and the members I’ve been able to interact with so far.
One of the great things about this new role is all the opportunities to do more of what I really enjoy doing, which I’m confident will translate to valuable resources and insights for members and audiences beyond.
And being a part of a member-focused organization like REBGV, I’m excited to hear from you too! If you have questions, thoughts, or just want to reach out and introduce yourself, don’t hesitate!
Metro Vancouver & Fraser Valley sales have cooled off considerably.
The most reliable indicator of market prices is the Sales to Active Listings Ratio (SAL). This is the ratio between the number of sales in a given month and the number of active listings at month-end.
In hotter markets in BC, a long-term analysis has shown that prices will usually act in the following ways:
- 7+ Months of Inventory (Under 14% SAL): Prices will likely DECLINE
- 5 – 7 Months of Inventory (14% – 18% SAL): Prices will likely be STABLE
- Less than 5.5 Months of Inventory (Over 18% SAL): Prices will likely RISE
Visit this link to learn more about house prices and inventory.

About Shauna
As an agent with the largest realtor network in Canada, Macdonald Realty, Shauna O’Callaghan, works locally on a national scale. Shauna’s excellent reputation is the result of unparalleled respect for clients and market smarts.
Market News
Sign Up for Market Updates and More!
Keep In Touch
Office
Macdonald Realty
#30, 1040 Legacy Way
Whistler, BC V0N 1B1
7409 Treetop Lane
Whistler, BC
Call Us
Mail to
© Copyright 2020 Shauna O’Callaghan – Site Crafted By: Whistler Web & Print