May 2022 – Lower Mainland Monthly Update (REBGV & FVREB)
Originally posted by Macdonald Realty.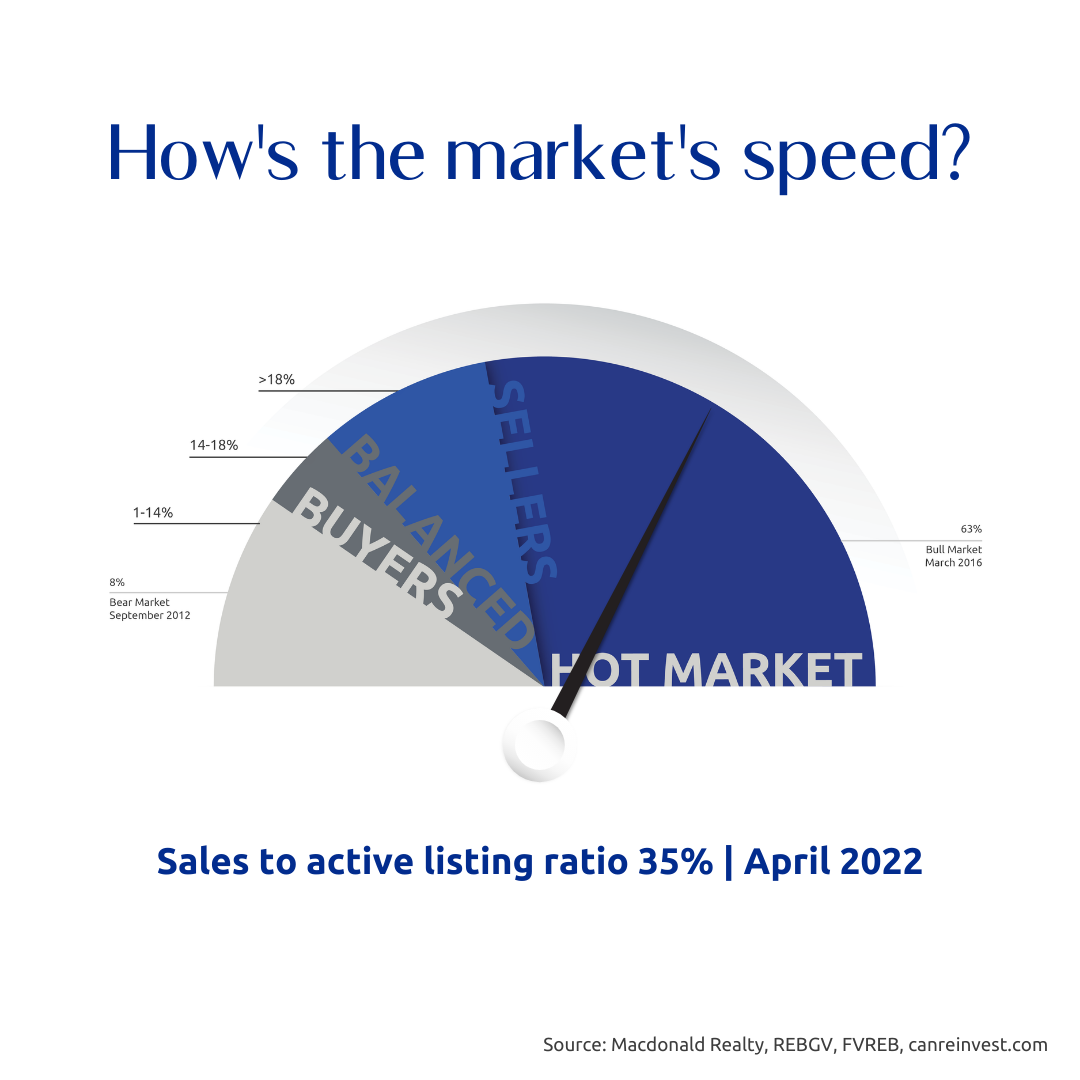
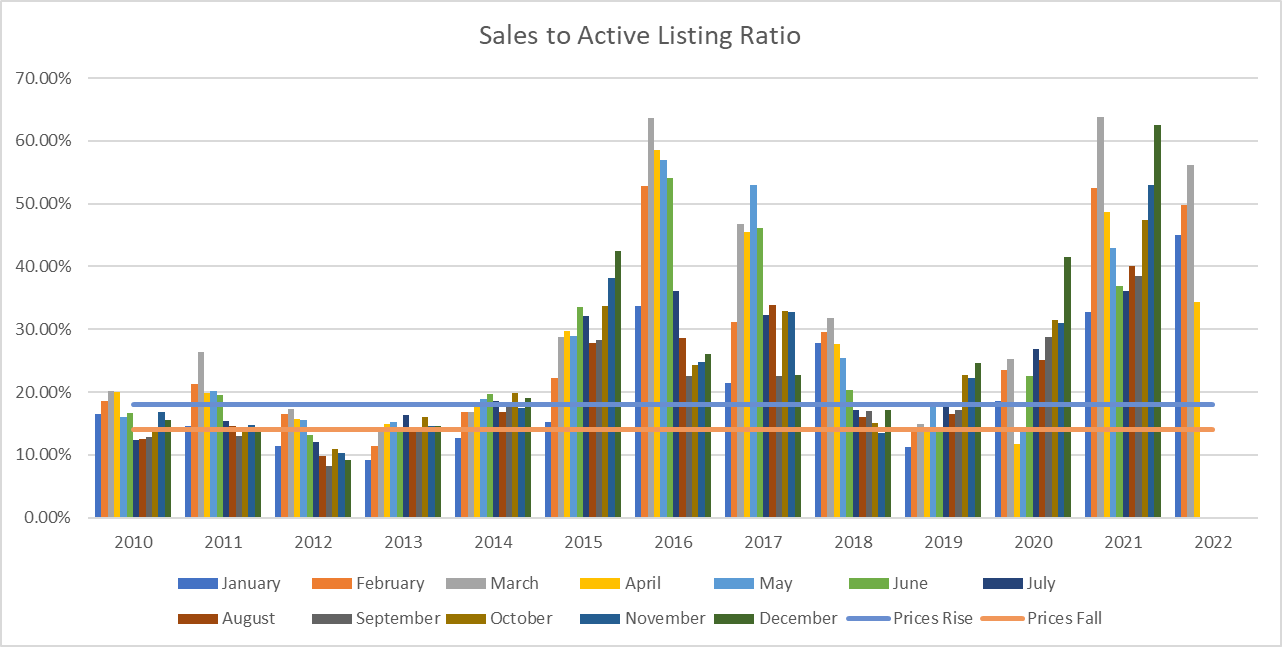
The most reliable indicator of market prices is the Sales to Active Listings Ratio (SAL). This is the ratio between the number of sales in a given month and the number of active listings at month-end.
In hotter markets in BC, a long-term analysis has shown that prices will usually act in the following ways:
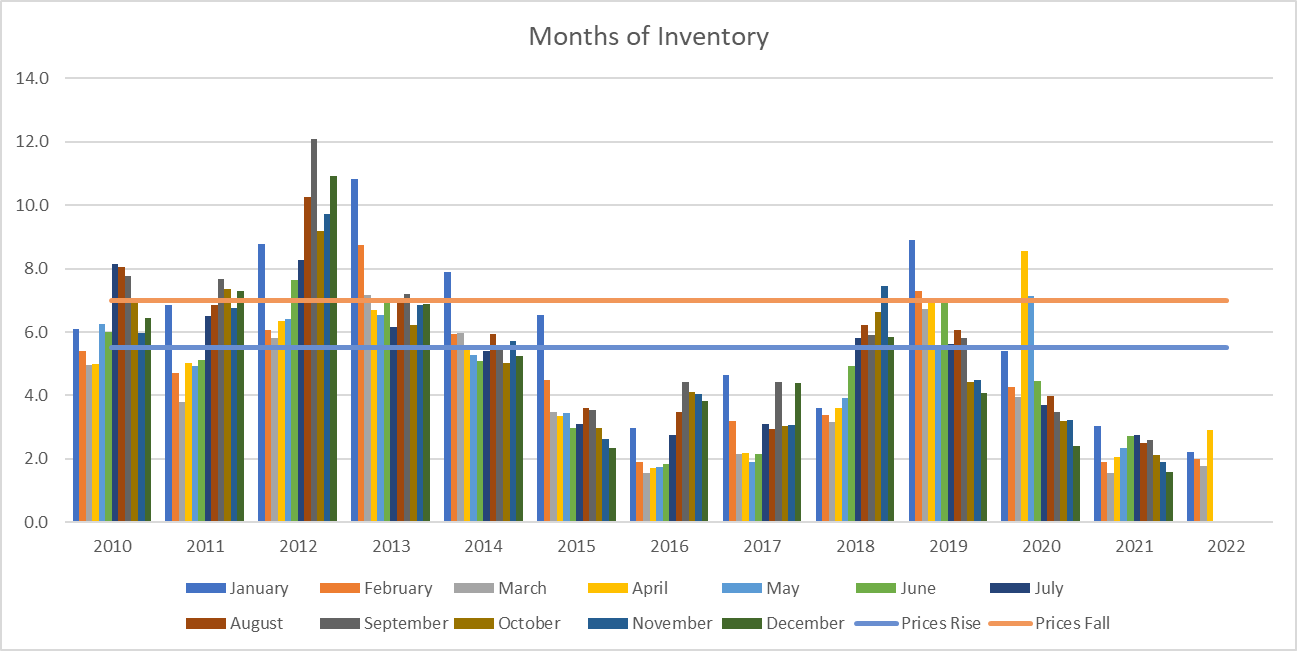
- 7+ Months of Inventory (Under 14% SAL): Prices will likely DECLINE
- 5 – 7 Months of Inventory (14% – 18% SAL): Prices will likely be STABLE
- Less than 5.5 Months of Inventory (Over 18% SAL): Prices will likely RISE
Visit this link to learn more about house prices and inventory.
Sales
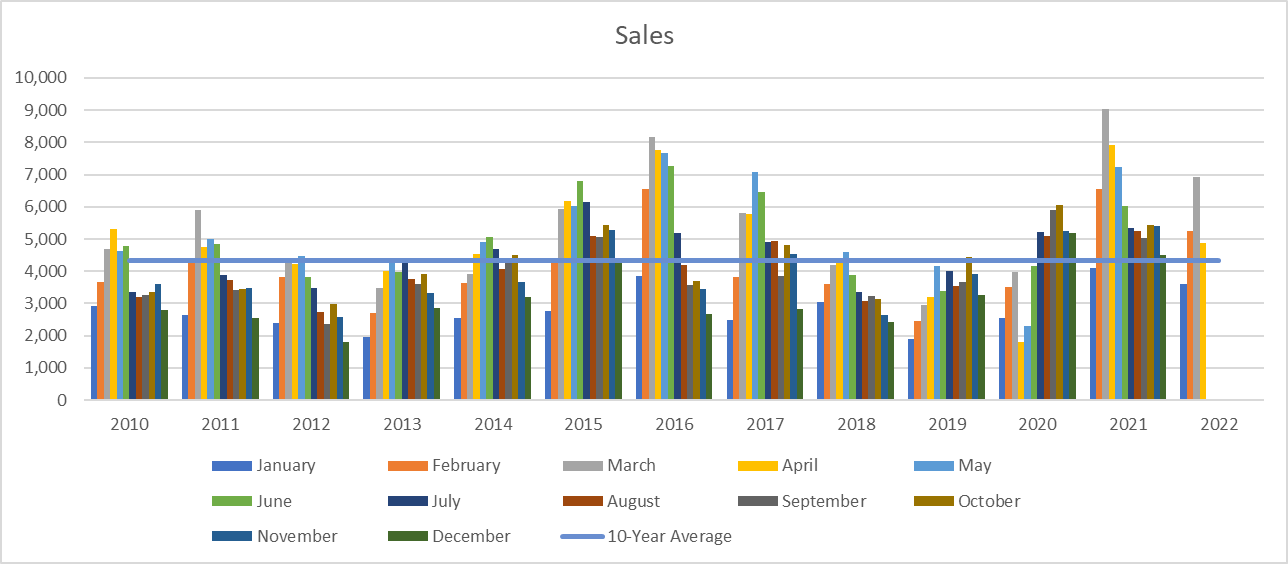
Sales have moderated in April and are now at the 10-year average (4,869 sales in April vs 4,969 average).

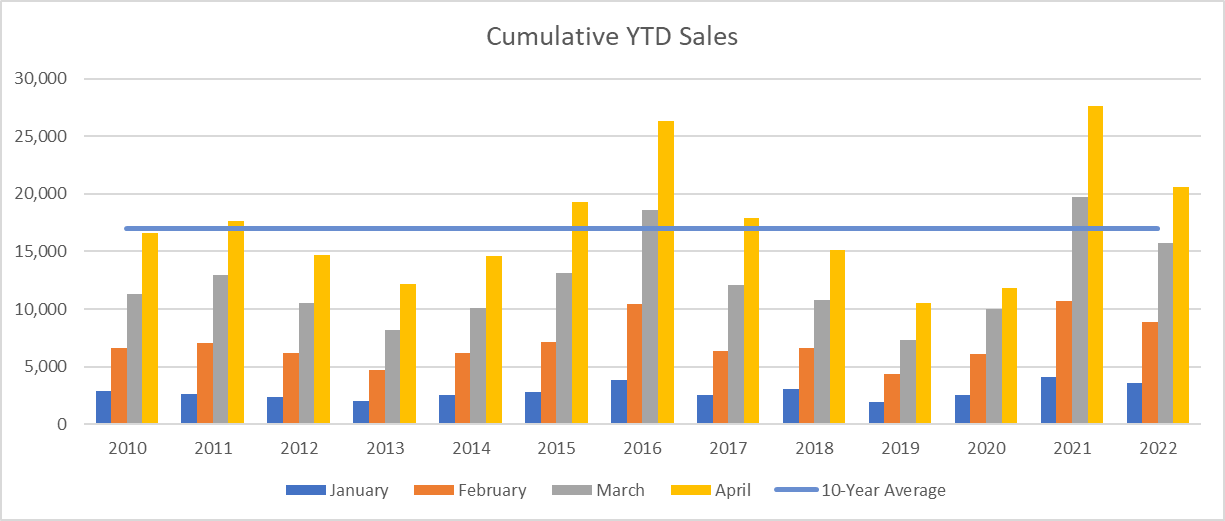
Cumulative Year-to-date Sales
Year-to-Date, we are still 20% above the 10-year average (20,636 sales vs 16,997 average).

Inventory
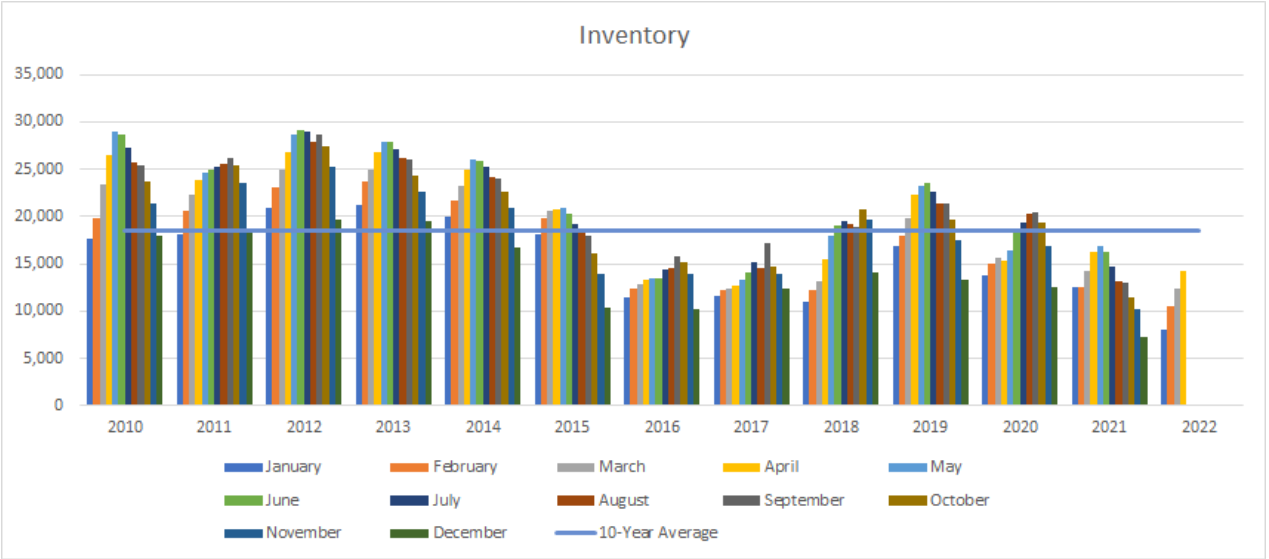
Inventory in April is no longer the lowest on record, but is still 25% below the 10-year average (14,183 listings vs 19,466 average).

Sales to Active Listings
SAL has dropped from 56% in March to 34% in April. Typically, a SAL of 34% would indicate rising prices, but given the trajectory, it likely means moderating prices.

Months of Inventory
Similarly to SAL, MOI has grown from 1.8 months to 2.9 months (a balanced market is 5.5 – 6.5 months), indicating a still tight, but moderating market.
