To keep you up to date with the Real Estate Listings in Whistler, here are links to all properties listed and sold in the last 7 days.
If you are interested in any of the properties or have any other questions, always feel free to contact us!
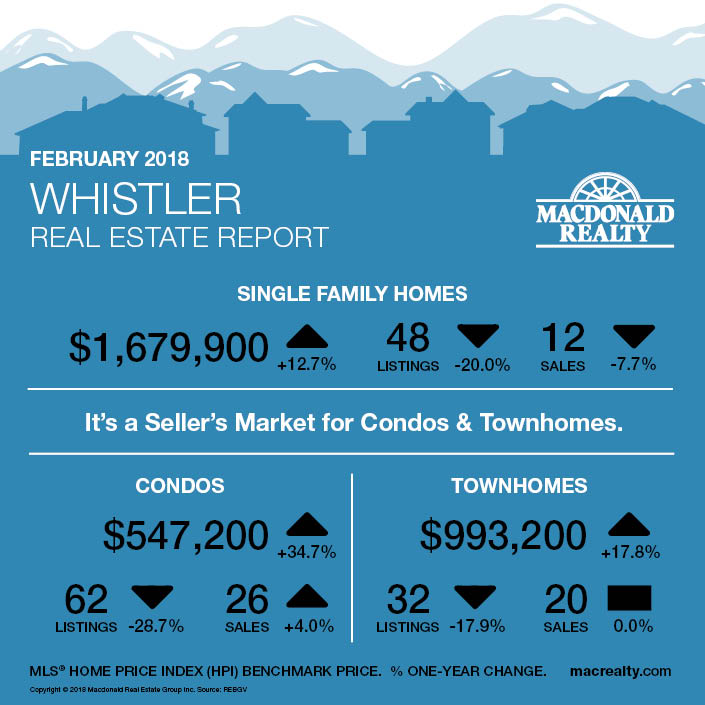
In the Whistler market, the benchmark sale price was $1,679,900 with an average days on market of 62 days for detached homes. At the end of the month, there were 12 sales and 48 active listings on the REBGV MLS® (excludes Whistler Listing System numbers).
In comparison, the condo market had 26 sales and 62 active listings. The benchmark sale price was $547,200, and the average days on market were 21.
Townhome featured 20 sales, 32 active listings and a $993,200 benchmark sale price with 39 days on market average.
It’s a seller’s market for condos & townhomes in Whistler.

So you have heard the market is crazy, but what does that mean?
The median price of a chalet home is $2.04m
The median price of a townhome is $900k
The median price of a condo is $487k
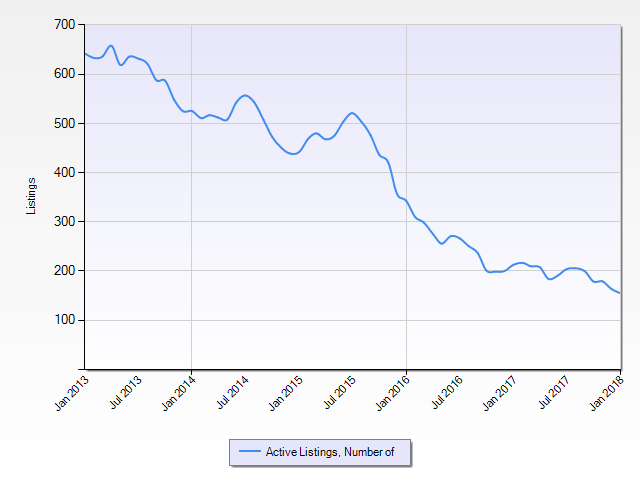
It’s a Seller’s market, due to very limited inventory. Today there are 155 listings for sale, which means as a Buyer you have 30 percent fewer choices to consider than at the same time last year. And in January 2016 there were 343 listings on the market. But the real story gets told when you look back five years ago and realize you had 4 times the amount of choices as you do today. In January 2013 we had 642 listings.
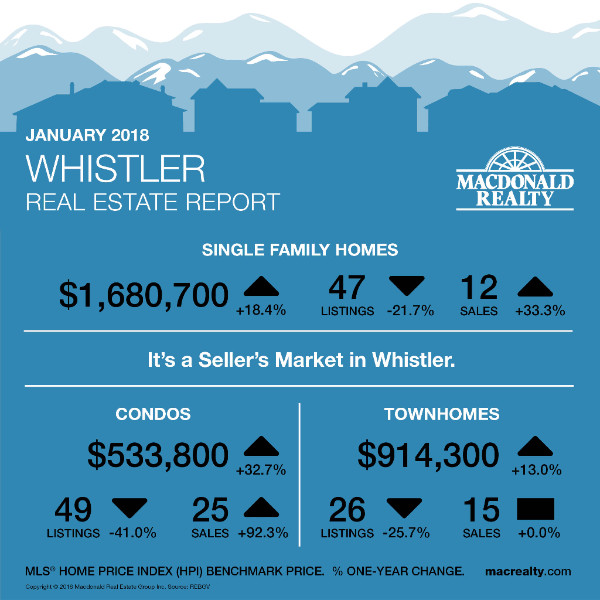
Whistler Market Update – January 2018
The report below shows benchmark prices for properties in Whistler. The HPI benchmarks represent the price of a typical property within the market. It takes into consideration what averages and medians do not – items such as lot size, age, number of rooms, etc. These features become the composite of the ‘typical house’ in a given area. Each month’s sales determine the current prices paid for bedrooms, bathrooms, fireplaces, etc. and apply those new values to the ‘typical’ house model.
If you would like to learn more about benchmark prices, follow this link for some great information.
What’s available? Follow the links to the wonderful properties that are on the market
Luxury Estates
Cheap and Cheerful Whistler Shacks
Village Blackcomb and Creekside – Properties you can rent yourself
Hotel Investment Properties aka. Phase Two
Shared Ownership
When the Village gets too busy… escape to Nicklaus North!
The Village can get very busy at this time of the year, if you are looking to escape and enjoy aprés, happy hour or a great dinner, Table Nineteen Lakeside Eatery at the Nicklaus North Golf Course is the place for you. One of our favourites with daily specials, Happy Hour and a spectacular view of Green Lake!
HAPPY HOUR 4pm to 5pm in the lounge: $5 Beer/Wine, $10 Burger/Fries or Nachos, $14 Cheese Fondue For Two (p/p).
WEEKLY FEATURES:
Monday & Tuesday (4-5:30pm reservations only): $36 Four-Course Fondue
Wednesday: $49 Fondue Date Night.
Bottle of wine, cheese & chocolate fondue for two.
Thursday: Happy Hour All Night
Friday: $29 Prime Rib
Sunday: Half Price Select Bottles of Wine
To keep you up to date with the Real Estate Listings in Whistler, here are links to all properties listed and sold in the last 7 days.
If you are interested in any of the properties or have any other questions, always feel free to contact us!
To keep you up to date with the Real Estate Listings in Whistler, here are links to all properties listed and sold in the last 7 days.
If you are interested in any of the properties or have any other questions, always feel free to contact us!
This was sent to us by a special client last year, too good not to share!
‘Twas the night before Christmas, Revised!
‘Twas the night before Christmas, when all though the house
Not a creature was stirring, not even a mouse;
The stockings were hung by the chimney with care,
In hopes that St. Nicholas soon would be there;
The children were nestled all snug in their beds,
While visions of sugar-plums danced in their heads;
And mama in her ‘kerchief, and I in my cap,
Had just settled in bed for a long winter’s nap.
When at the foot of my bed there arose such a clatter,
I bolted upright to see what was the matter.
At the head of my bed, with a smile that was drawn,
Stood my esteemed realtor, Shauna O’Callaghan!
Why Shauna, I cried, you gave us a fright
Coming to our house in the middle of the night.
You should be at your home, what caused you to leave
To visit our home on this Christmas Eve?
That Gingerbread house I gave you last week
With the Gingerbread walls edged in icing and sweets
Well, I must have it back; circumstances are dire
I since have acquired a new first home buyer!
With an interest-free loan and approval in place
These first-time buyers now need a home base!
But Shauna, I cried in dismay, you are too late
Some parts of the house we inadvertently ate!
The door and the floor we had for our supper
And now it is just a sad fixer-upper!
To make matters worse one evening quite late,
We snacked on the rest; it’s now bulldozer bait!
She replied with a face that was sweet and forgiving
All is not lost; ‘tis the season for giving!
She then sprang to her car and drove out of sight
Exclaiming, HAPPY CHRISTMAS TO ALL AND TO ALL A GOOD NIGHT

New Year. Fresh Start.

As many of you know, 2017 was a year of immense challenges for my family, especially when my eldest daughter Louise was diagnosed with cancer. Thanks largely to the support of our incredible Whistler community, our family weathered the many curveballs life threw us this year.
I am happy to report that Louise is doing well and I am confident that she is on the road to recovery. I am so appreciative for her life, for my family and all of you. Thank you from the bottom of my heart.
Additionally, I want to let everyone know that I’m back to work full time. And I am ready to go. I want to share my passion for Whistler with other families who are ready to invest in this wonderful community, experience this amazing lifestyle and build warm, playful memories to last a lifetime.
If you have friends considering investing in the market or if you are ready to list or buy, please be in touch. I am ready to hit 2018 with everything I’ve got.
From our heart to yours. Happy New Year.

Shauna O’Callaghan
Louise (20), Sophie (16) and Hugh (14) – The Saint-Jacques
Jake (8) and our loving yappy, bitchy dog Molly
Why not tour all the wonderful properties available in Whistler:
Luxury Estates
Cheap and Cheerful Whistler Shacks
Village Blackcomb and Creekside – Properties you can rent yourself
Hotel Investment Properties aka. Phase Two
We have still been busy, click here to see all of the properties we have sold…
Metro Vancouver continues to experience above-average demand and below-average supply
Metro Vancouver* saw modest home listing changes and steady demand in November.
The Real Estate Board of Greater Vancouver (REBGV) reports that residential home sales in the region totalled 2,795 in November 2017, a 26.2 per cent increase from the 2,214 sales recorded in November 2016, and a 7.5 per cent decrease compared to October 2017 when 3,022 homes sold.
Last month’s sales were 17 per cent above the 10-year November sales average.
“We’re seeing steady demand in today’s market. Home buyer activity is operating above our long-term averages, particularly in our townhome and condominium markets,” Jill Oudil, REBGV president said.
There were 4,109 detached, attached and apartment properties newly listed for sale on the Multiple Listing Service® (MLS®) in Metro Vancouver in November 2017. This represents a 30.6 per cent increase compared to the 3,147 homes listed in November 2016 and a 9.5 per cent decrease compared to October 2017 when 4,539 homes were listed.
The total number of homes currently listed for sale on the MLS® system in Metro Vancouver is 8,747, a 4.3 per cent increase compared to November 2016 (8,385) and a 4.3 per cent decrease compared to October 2017 (9,137).
“While we’re seeing more listings enter the market today than we saw at this time last year, we have a long way to go before our home listing inventory rises back to more historically typical levels,” Oudil said.
The sales-to-active listings ratio for November 2017 is 32 per cent, which is up three per cent since September 2017. By property type, the ratio is 15.9 per cent for detached homes (up one per cent since September 2017), 36.4 per cent for townhomes (down six per cent since September 2017), and 67.8 per cent for condominiums (up seven per cent since September 2017).
Generally, analysts say that downward pressure on home prices occurs when the ratio dips below the 12 per cent mark for a sustained period, while home prices often experience upward pressure when it surpasses 20 per cent over several months.
The MLS® Home Price Index composite benchmark price for all residential properties in Metro Vancouver is currently $1,046,900. This represents a 14 per cent increase over November 2016 and a 0.4 per cent increase compared to October 2017.
Sales of detached properties in November 2017 reached 841, a 31.8 per cent increase from the 638 detached sales recorded in November 2016. The benchmark price for detached properties is $1,608,000. This represents a 6.1 per cent increase from November 2016 and a 0.1 per cent decrease compared to October 2017.
Sales of apartment properties reached 1,508 in November 2017, a 25.7 per cent increase compared to the 1,200 sales in November 2016. The benchmark price of an apartment property is $648,200. This represents a 23.9 per cent increase from November 2016 and a one per cent increase compared to October 2017.
Attached property sales in November 2017 totalled 446, an 18.6 per cent increase compared to the 376 sales in November 2016. The benchmark price of an attached unit is $805,200. This represents a 17.9 per cent increase from November 2016 and a 0.3 per cent increase compared to October 2017.
Click here to download the November 2017 stats package
To keep you up to date with the Real Estate Listings in Whistler, here are links to all properties listed and sold in the last 7 days.
If you are interested in any of the properties or have any other questions, always feel free to contact us!
To keep you up to date with the Real Estate Listings in Whistler, here are links to all properties listed and sold in the last 7 days.
If you are interested in any of the properties or have any other questions, always feel free to contact us!
The Real Estate Board of Greater Vancouver (REBGV) reports that residential property sales in the region totalled 3,022 in October 2017, a 35.3 per cent increase from the 2,233 sales recorded in October 2016, and an increase of 7.1 per cent compared to September 2017 when 2,821 homes sold.
Last month’s sales were 15 per cent above the 10-year October sales average.
“Conditions continue to vary significantly based on property type. The detached home market is well supplied with homes for sale, which is relieving pressure on prices,” Jill Oudil, REBGV president said. “It remains a much different story in the townhouse and apartment markets. Buyers of these properties continue to have limited supply to choose from and are seeing upward pressure on prices.”
There were 4,539 detached, attached and apartment properties newly listed for sale on the Multiple Listing Service® (MLS®) in Metro Vancouver in October 2017. This represents a 14 per cent increase compared to the 3,981 homes listed in October 2016 and a 15.6 per cent decrease compared to September 2017 when 5,375 homes were listed.
The total number of properties currently listed for sale on the MLS® system in Metro Vancouver is 9,137, a 0.1 per cent decrease compared to October 2016 (9,143) and a 3.5 per cent decrease compared to September 2017 (9,466).
For all property types, the sales-to-active listings ratio for October 2017 is 33.1 per cent. By property type, the ratio is 16.8 per cent for detached homes, 44.8 per cent for townhomes, and 66 per cent for condominiums.
Generally, analysts say that downward pressure on home prices occurs when the ratio dips below the 12 per cent mark for a sustained period, while home prices often experience upward pressure when it surpasses 20 per cent over several months.
“The growth in our provincial economy and job market is contributing to today’s demand,” Oudil said. “The federal government’s announcement of plans to tighten mortgage requirements for the seventh time in the last eight years also helped spur activity in the short term. Many buyers are trying to enter the market before the changes are in place.”
The MLS® Home Price Index composite benchmark price for all residential properties in Metro Vancouver is currently $1,042,300. This represents a 12.4 per cent increase over October 2016 and a 0.5 per cent increase compared to September 2017.
Sales of detached properties in October 2017 reached 940, a 44.2 per cent increase from the 652 detached sales recorded in October 2016 and a 34.6 per cent decrease from the 1,437 sales in October 2015. The benchmark price for detached properties is $1,609,600. This represents a four per cent increase from October 2016 and a 0.5 per cent decrease compared to September 2017.
Sales of apartment properties reached 1,532 in October 2017, a 30.1 per cent increase compared to the 1,178 sales in October 2016 and a 0.7 per cent decrease from the 1,543 sales in October 2015. The benchmark price of an apartment property is $642,000. This represents a 22.7 per cent increase from October 2016 and a one per cent increase compared to September 2017.
Attached property sales in October 2017 totalled 550, a 36.5 per cent increase compared to the 403 sales in October 2016 and a 17.4 per cent decrease from the 666 sales in October 2015. The benchmark price of an attached unit is $802,400. This represents a 17.7 per cent increase from October 2016 and a two per cent increase compared to September 2017.
Click here to download the October 2017 stats package
*Editor’s Note: Areas covered by the Real Estate Board of Greater Vancouver include: Whistler, Sunshine Coast, Squamish, West Vancouver, North Vancouver, Vancouver, Burnaby, New Westminster, Richmond, Port Moody, Port Coquitlam, Coquitlam, Pitt Meadows, Maple Ridge, and South Delta.
To keep you up to date with the Real Estate Listings in Whistler, here are links to all properties listed and sold in the last 7 days.
If you are interested in any of the properties or have any other questions, always feel free to contact us!
Home buyer demand continues to differ based on housing type
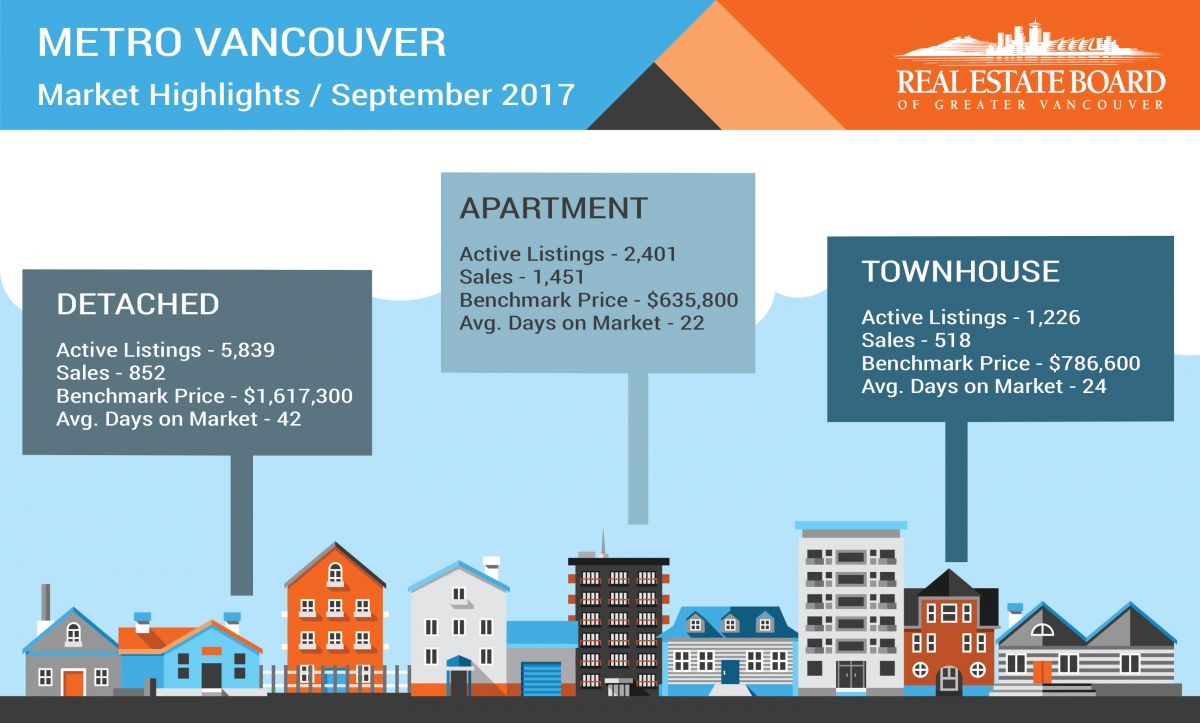
Apartment and townhome activity is outpacing the detached home market across Metro Vancouver*. This activity helped push total residential sales above the historical average in September.
The Real Estate Board of Greater Vancouver (REBGV) reports that residential property sales in the region totalled 2,821 in September 2017, a 25.2 per cent increase from the 2,253 sales recorded in September 2016, and a 7.3 per cent decrease compared to August 2017 when 3,043 homes sold.
Last month’s sales were 13.1 per cent above the 10-year September sales average.
“Our detached homes market is balanced today, while apartment and townhome sales remain in sellers’ market territory,” Jill Oudil, REBGV president said. “If you’re looking to enter the market, as either a buyer or seller, it’s important to understand these trends and use this information to set realistic expectations.”
There were 5,375 detached, attached and apartment properties newly listed for sale on the Multiple Listing Service® (MLS®) in Metro Vancouver in September 2017. This represents a 12 per cent increase compared to the 4,799 homes listed in September 2016 and a 26.6 per cent increase compared to August 2017 when 4,245 homes were listed.
The total number of homes currently listed for sale on the MLS® system in Metro Vancouver is 9,466, a 1.2 per cent increase compared to September 2016 (9,354) and a 7.5 per cent increase compared to August 2017 (8,807).
“Detached homes made up 30 per cent of all sales in September and represented 62 per cent of all the homes listed for sale on the MLS®,” said Oudil. “This dynamic has slowed the pace of upward pressure that we’ve seen on detached home prices in our market over the last few years.”
For all property types, the sales-to-active listings ratio for September 2017 is 29.8 per cent. By property type, the ratio is 14.6 per cent for detached homes, 42.3 per cent for townhomes, and 60.4 per cent for apartments.
Generally, analysts say that downward pressure on home prices occurs when the ratio dips below the 12 per cent mark for a sustained period, while home prices often experience upward pressure when it surpasses 20 per cent over several months.
The MLS® Home Price Index composite benchmark price for all residential properties in Metro Vancouver is currently $1,037,300. This represents a 10.9 per cent increase over September 2016 and a 0.7 per cent increase compared to August 2017.
Sales of detached properties in September 2017 reached 852, a 27.9 per cent increase from the sales recorded in September 2016 (666), a decrease of 33 per cent from September 2015 (1,272), and a decrease of 32.9 per cent from September 2014 (1,270). The benchmark price for detached properties is $1,617,300. This represents a 2.9 per cent increase from September 2016 and a 0.1 per cent increase compared to August 2017.
Sales of apartment properties reached 1,451 in September 2017, a 19.1 per cent increase compared from the sales recorded in September 2016 (1,218), a 5.1 per cent decrease from September 2015 (1,529), and a 22.1 per cent increase from September 2014 (1,188). The benchmark price of an apartment property is $635,800. This represents a 21.7 per cent increase from September 2016 and a 1.4 per cent increase compared to August 2017.
Attached property sales in September 2017 totalled 518, a 40.4 per cent increase compared to the sales recorded in September 2016 (369), a 4.8 per cent decrease from September 2015 (544), and an 11.6 per cent increase from September 2014 (464). The benchmark price of an attached home is $786,600. This represents a 14.5 per cent increase from September 2016 and a 1.1 per cent increase compared to August 2017.
Click here to download the September 2017 stats package
Competition for condominiums and townhomes pushed Metro Vancouver* home sales above typical levels in August.
The Real Estate Board of Greater Vancouver (REBGV) reports that residential property sales in the region totalled 3,043 in August 2017, a 22.3 per cent increase from the 2,489 sales recorded in August 2016, and a 2.8 per cent increase compared to July 2017 when 2,960 homes sold.
Last month’s sales were 19.6 per cent above the 10-year August sales average.
“First-time home buyers have led a surge this summer in demand in our condominium and townhome markets,” Jill Oudil, REBGV president said. “Homes priced between $350,000 and $750,000 have been subject to intense competition and multiple offers across the region.”
There were 4,245 detached, attached and apartment properties newly listed for sale on the Multiple Listing Service® (MLS®) in Metro Vancouver in August 2017. This represents a 1.1 per cent decrease compared to the 4,293 homes listed in August 2016 and a 19.2 per cent decrease compared to July 2017 when 5,256 homes were listed.
The total number of properties currently listed for sale on the MLS® system in Metro Vancouver is 8,807, a 3.5 per cent increase compared to August 2016 (8,506) and a 4.2 per cent decrease compared to July 2017 (9,194).
For all property types, the sales-to-active listings ratio for August 2017 is 34.6 per cent. By property type, the ratio is 16.3 per cent for detached homes, 44.8 per cent for townhomes, and 76.3 per cent for condominiums.
Generally, analysts say that downward pressure on home prices occurs when the ratio dips below 12 per cent for a sustained period, while home prices often experience upward pressure when it surpasses 20 per cent over several months.
“Conditions in our detached home market are distinct today from the dynamic in our condominium and townhome markets,” Oudil said. “Detached homes have entered a balanced market. This means there’s less upward pressure on prices and that buyers have more selection to choose from and more time to make their decisions.”
The MLS® Home Price Index composite benchmark price for all residential properties in Metro Vancouver is currently $1,029,700. This represents a 9.4 per cent increase over August 2016 and a one per cent increase compared to July 2017.
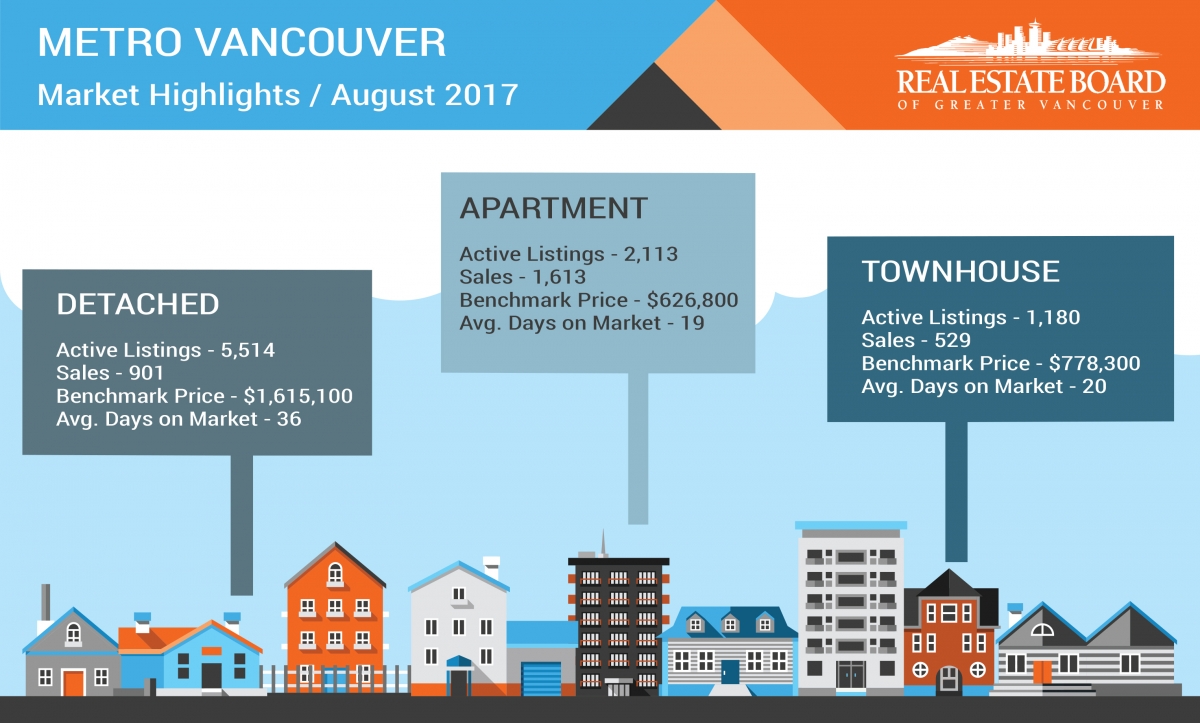
Sales of detached properties in August 2017 reached 901, a 26 per cent increase from the 715 detached sales recorded in August 2016. The benchmark price for detached properties is $1,615,100. This represents a 2.2 per cent increase from August 2016 and a 0.2 per cent increase compared to July 2017.
Sales of apartment properties reached 1,613 in August 2017, a 20.1 per cent increase compared to the 1,343 sales in August 2016. The benchmark price of an apartment property is $626,800. This represents a 19.4 per cent increase from August 2016 and a 1.7 per cent increase compared to July 2017.
Attached property sales in August 2017 totalled 529, a 22.7 per cent increase compared to the 431 sales in August 2016. The benchmark price of an attached unit is $778,300. This represents a 12.8 per cent increase from August 2016 and a 1.9 per cent increase compared to July 2017.
Click here to download the August 2017 stats package
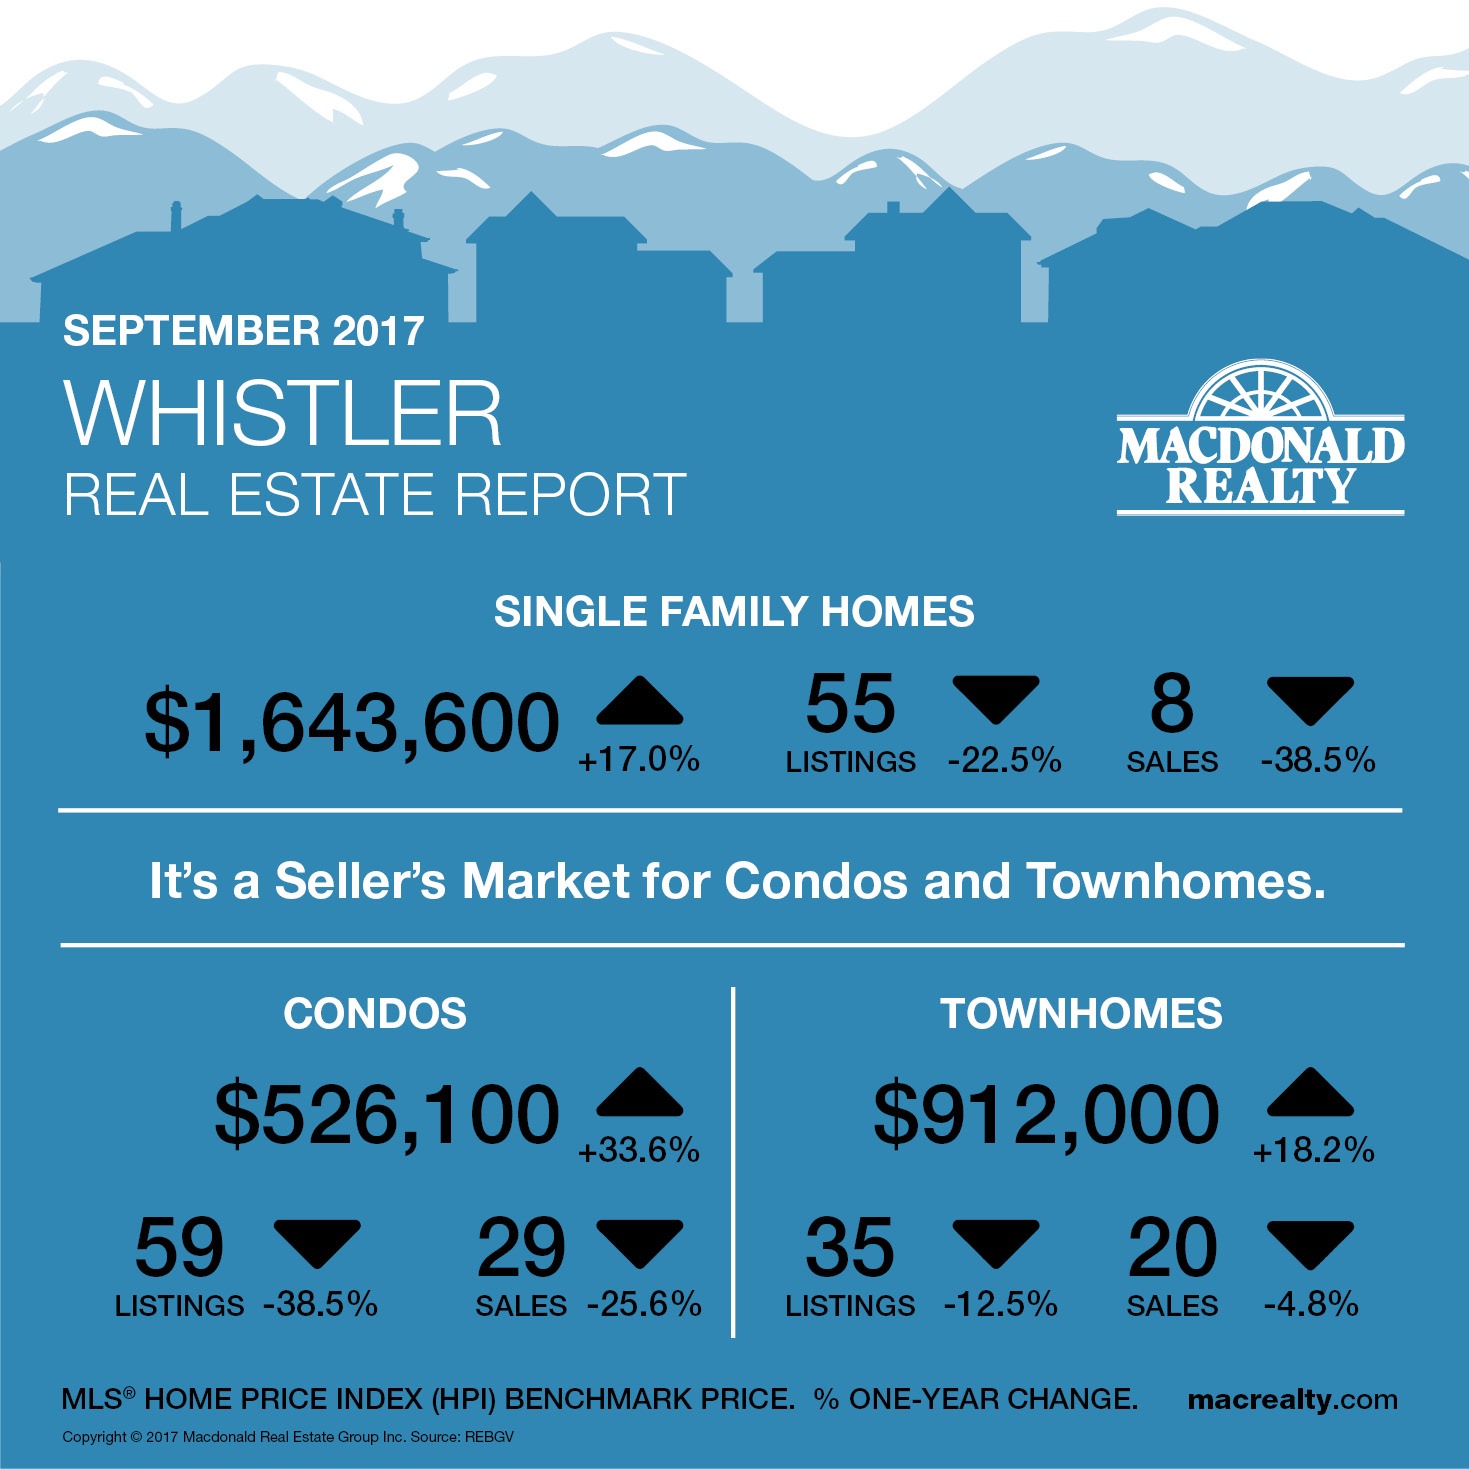
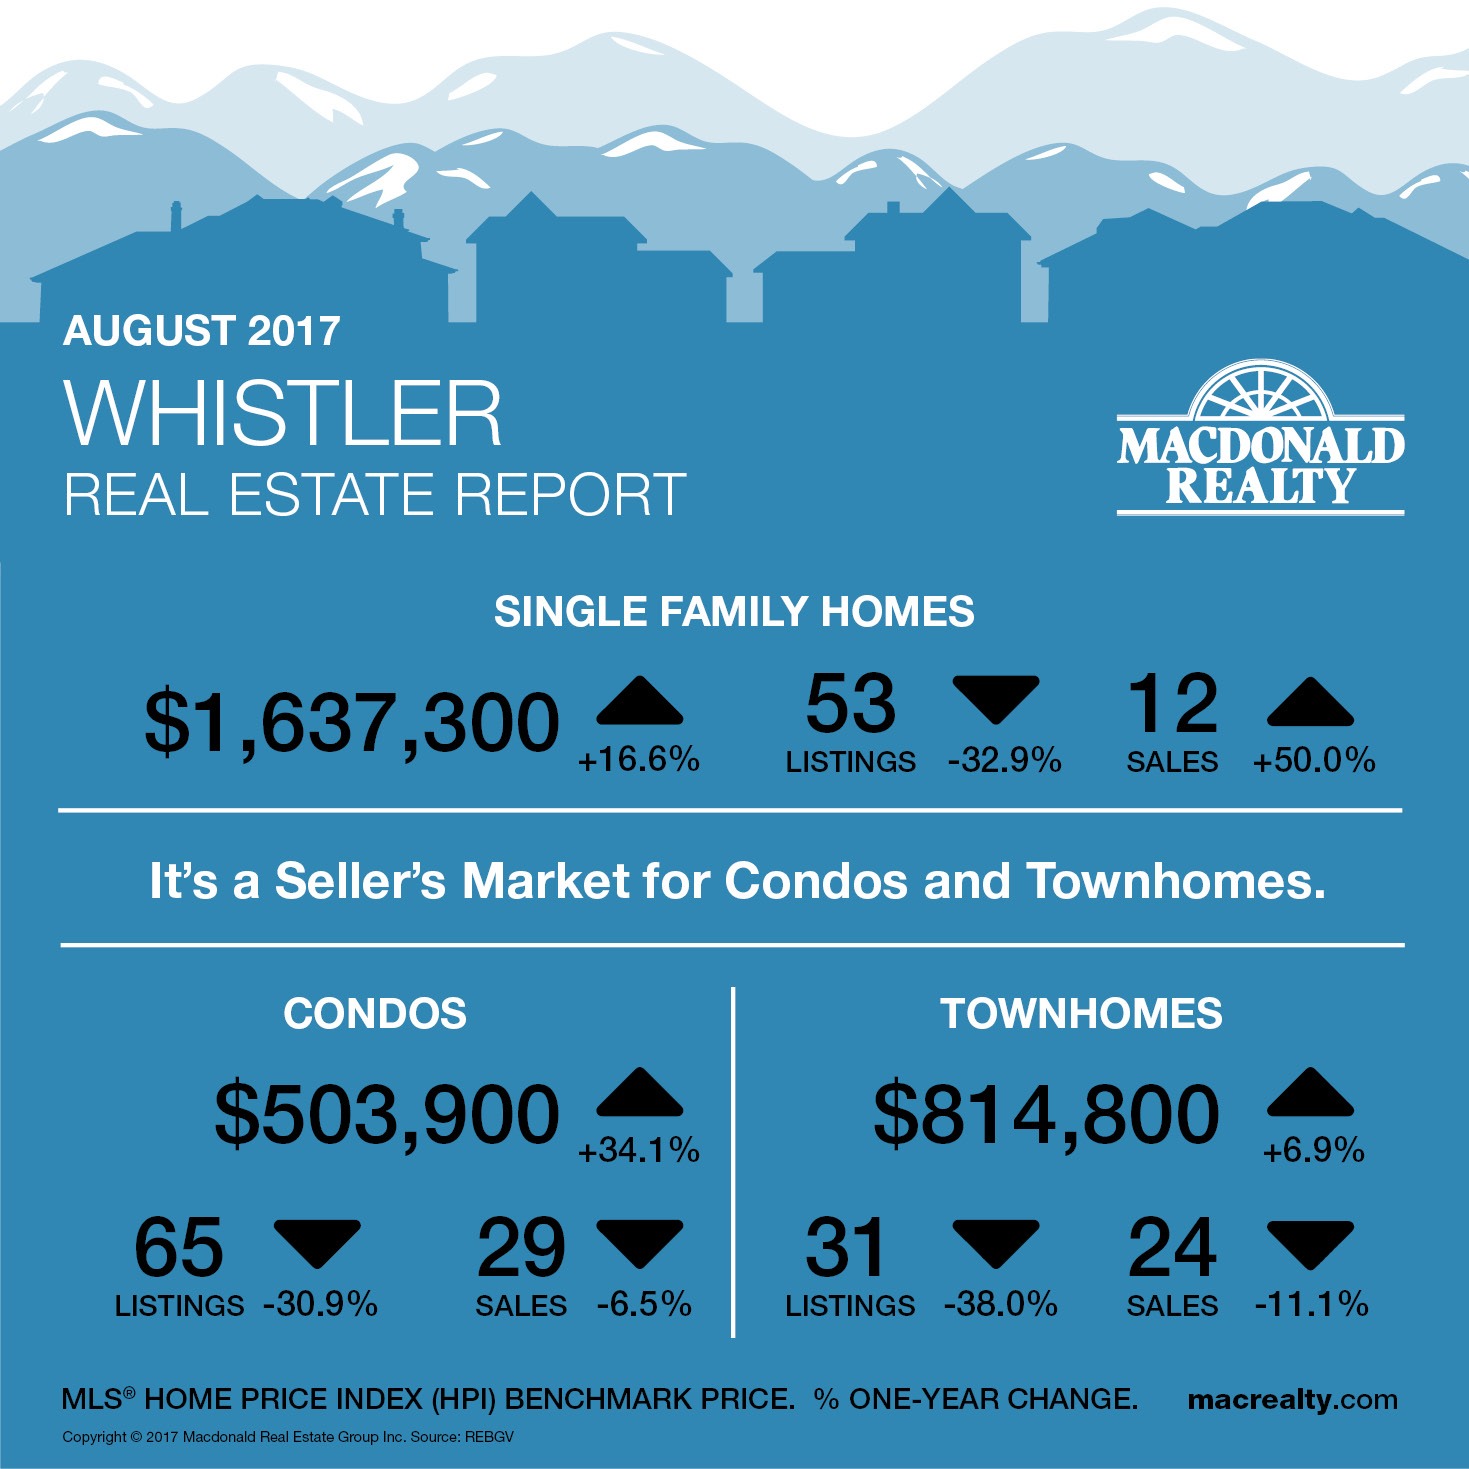
In the Whistler market, the benchmark sale price was $1,637,300 with an average days on market of 56 days for detached homes. At the end of the month, there were 12 sales and 53 active listings on the REBGV MLS® (excludes Whistler Listing System numbers).
In comparison, the condo market had 29 sales and 65 active listings. The benchmark sale price was $503,900, and the average days on market were 45.
Townhome featured 24 sales, 31 active listings and a $814,800 benchmark sale price with 17 days on market average
It’s a seller’s market for condos and townhomes.
To keep you up to date with the Real Estate Listings in Whistler, here are links to all properties listed and sold in the last 7 days.
If you are interested in any of the properties or have any other questions, always feel free to contact us!
To keep you up to date with the Real Estate Listings in Whistler, here are links to all properties listed and sold in the last 7 days.
If you are interested in any of the properties or have any other questions, always feel free to contact us!
The HPI benchmarks represent the price of a typical property within each market. The HPI takes into consideration what averages and medians do not – items such as lot size, age, number of rooms, etc. These features become the composite of the ‘typical house’ in a given area.
Each month’s sales determine the current prices paid for bedrooms, bathrooms, fireplaces, etc. and apply those new values to the ‘typical’ house model.
Here are links to all available properties in Whistler:
Click here to view all Chalets on the market
Click here to view all Townhouses on the market
Click here to view all the Phase One condos for sale
Click here to view all the Phase Two condo hotels for sale
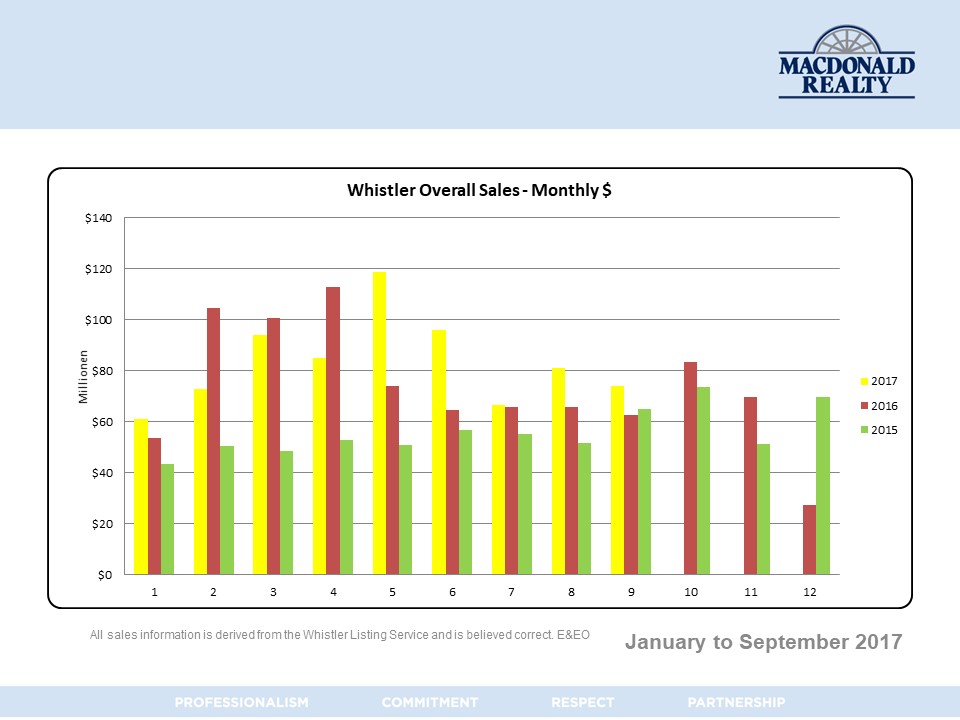
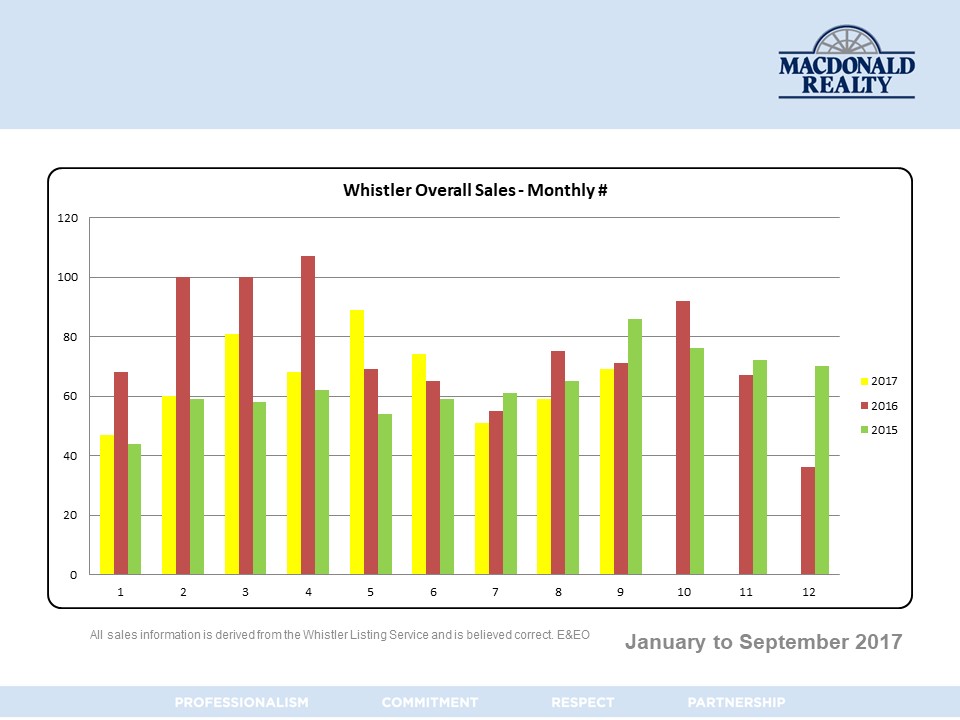
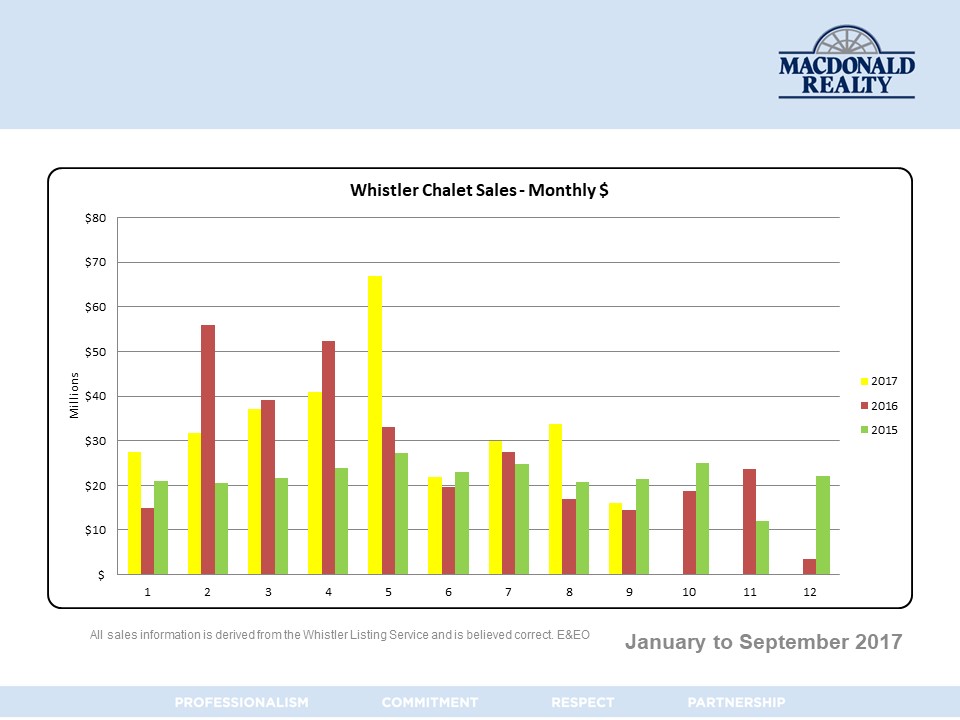
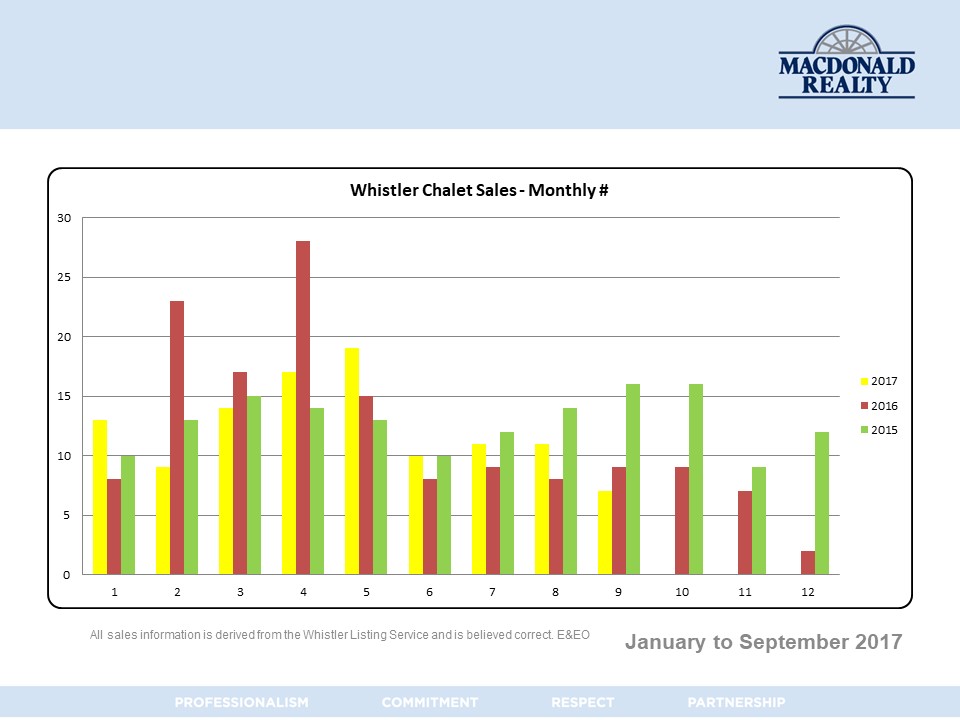
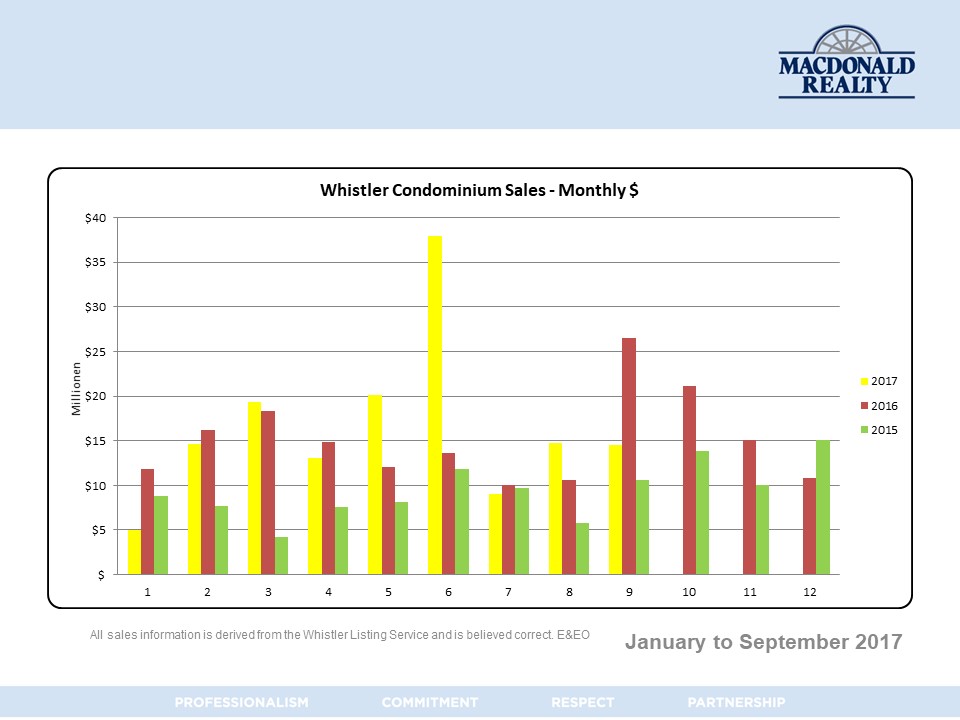
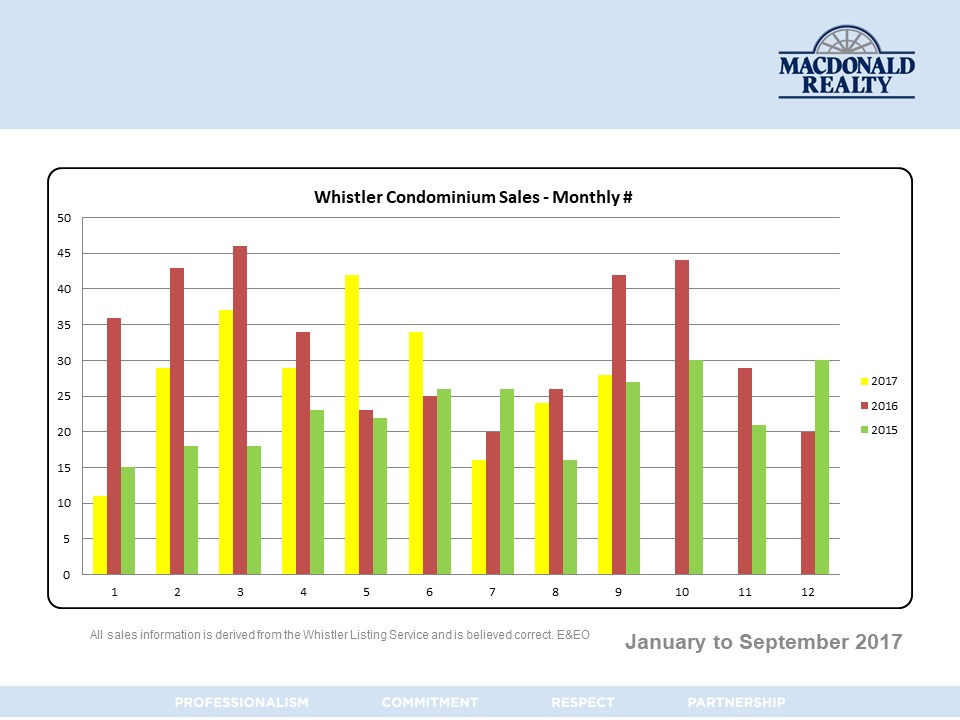
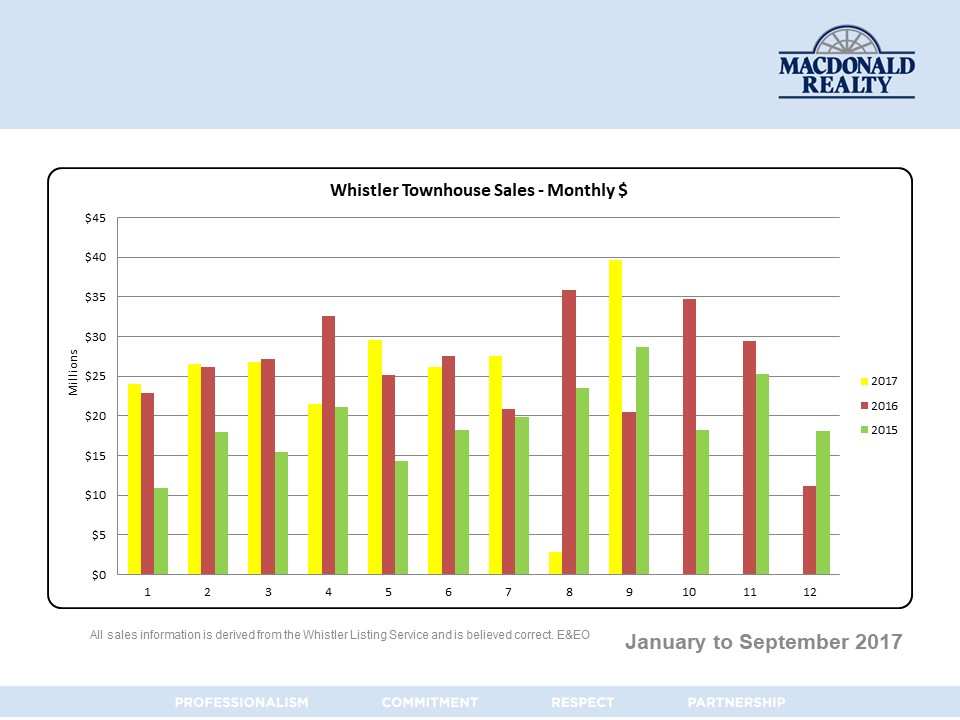
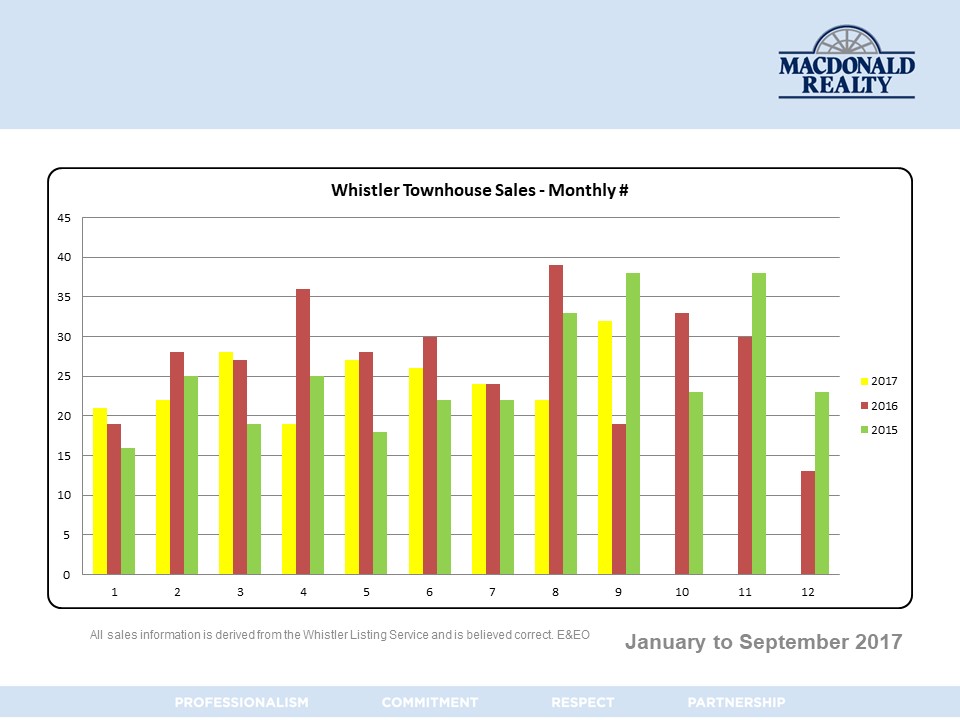
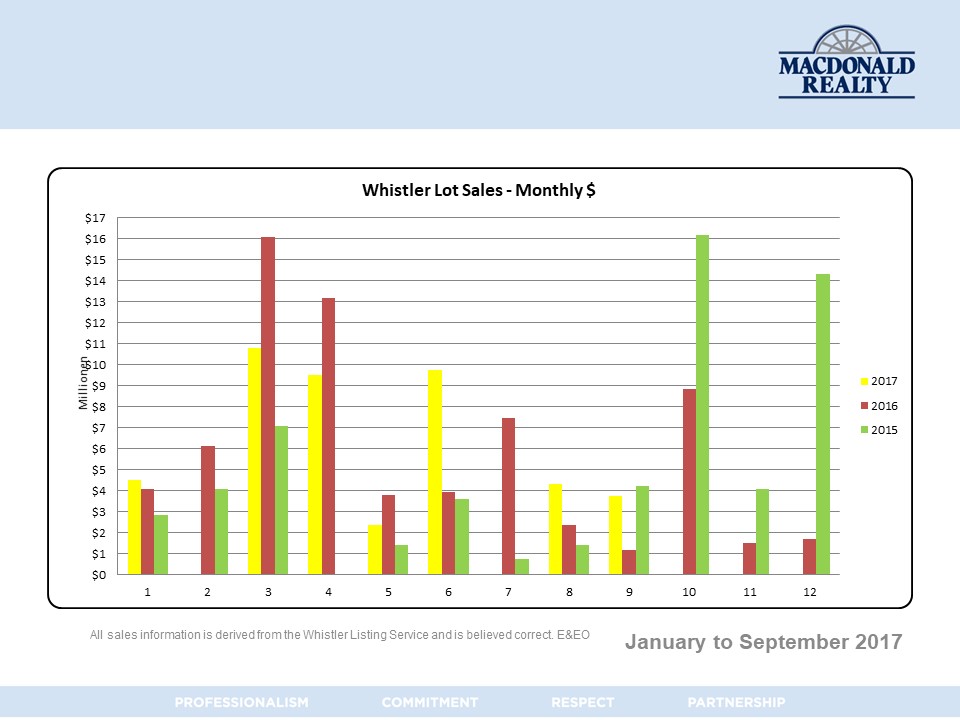
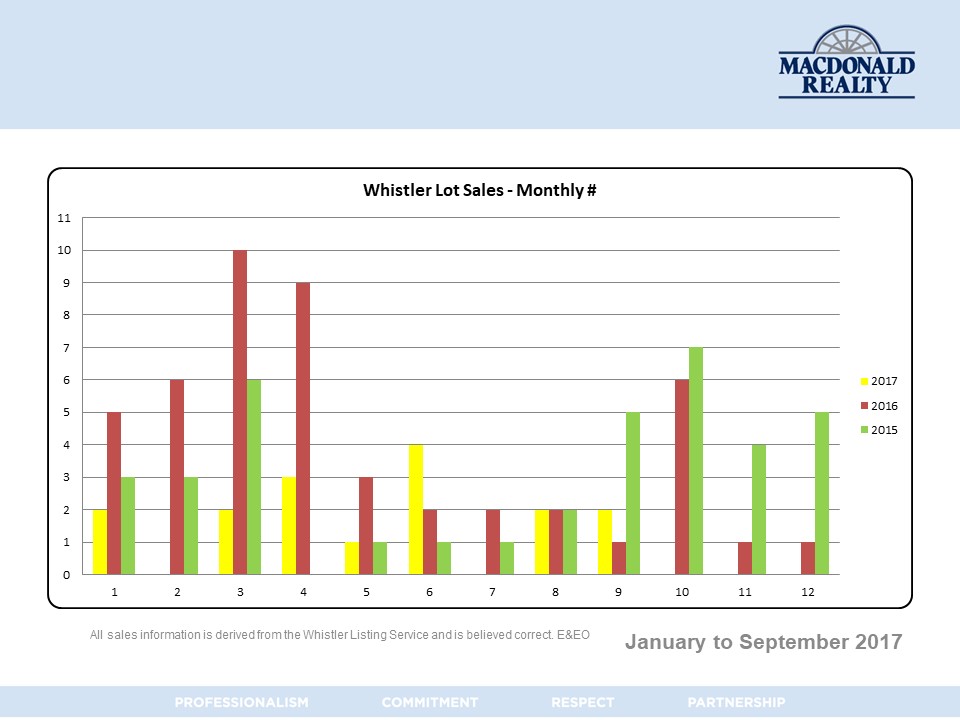
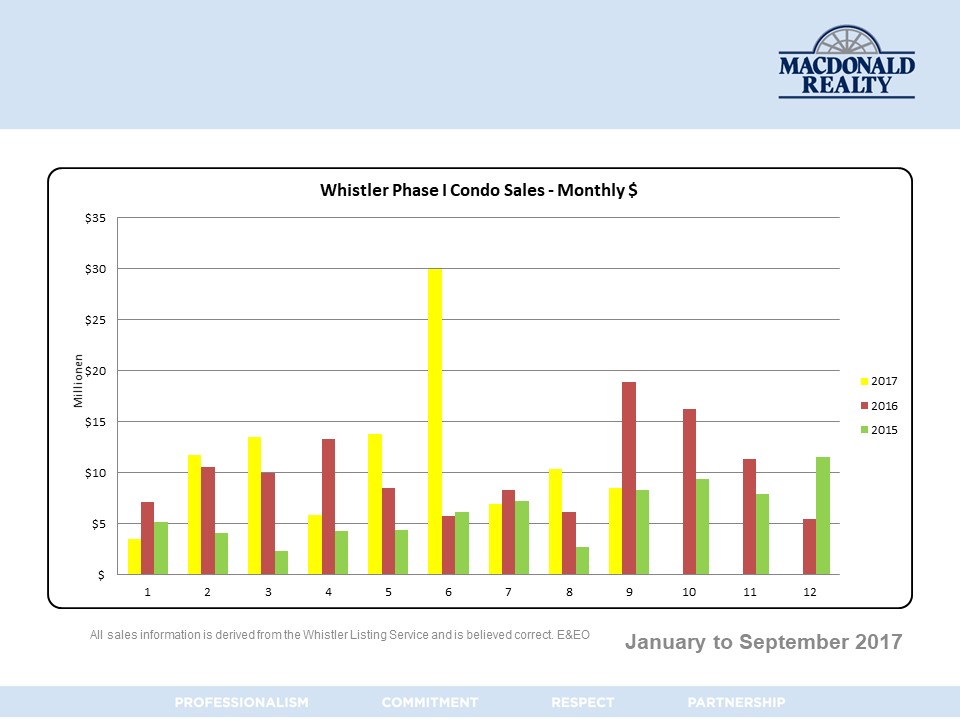
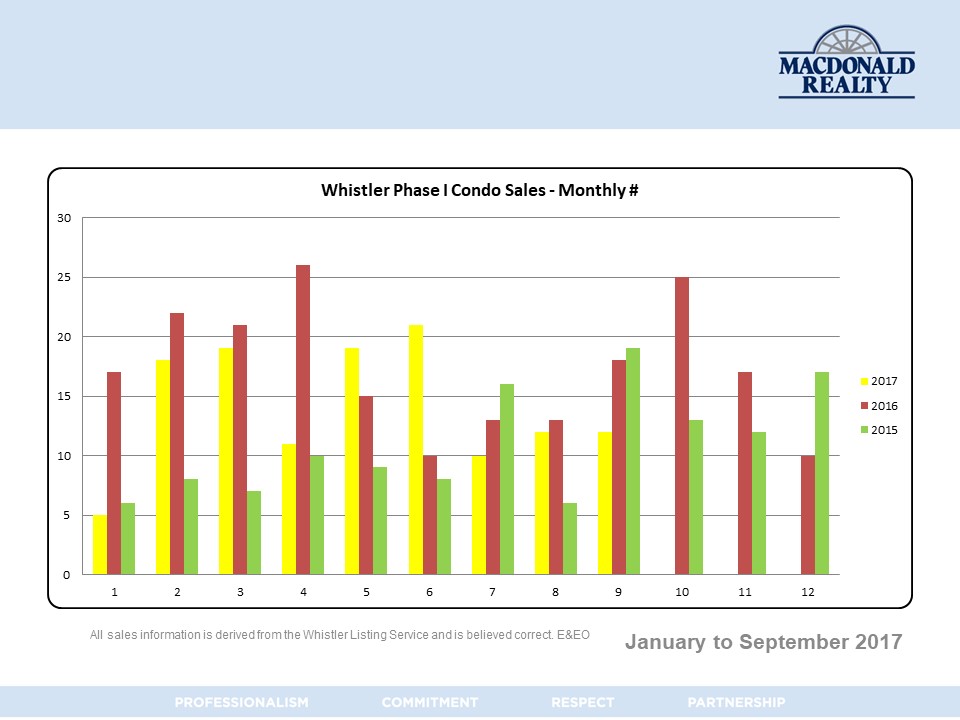
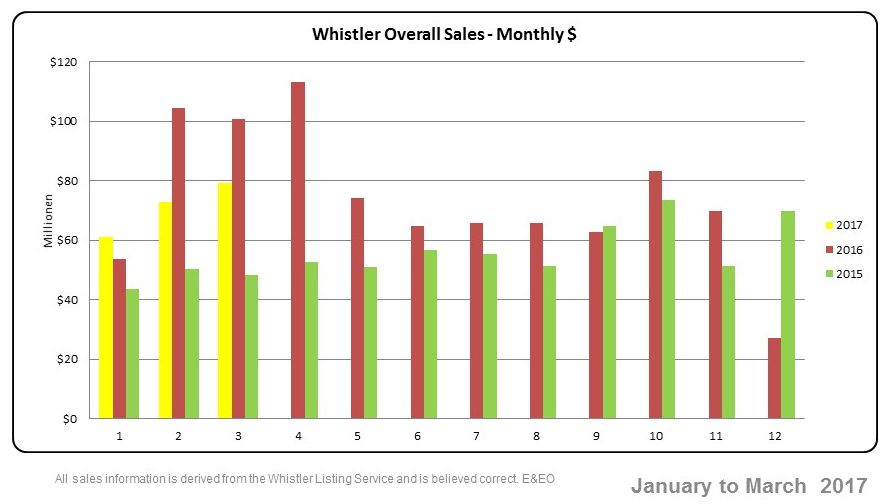
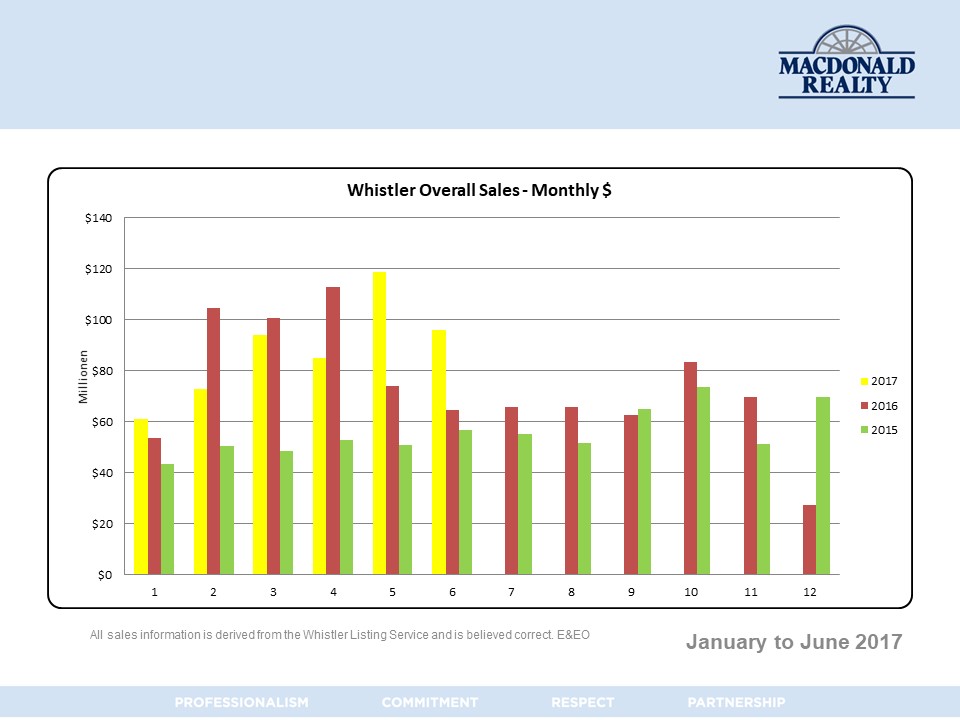
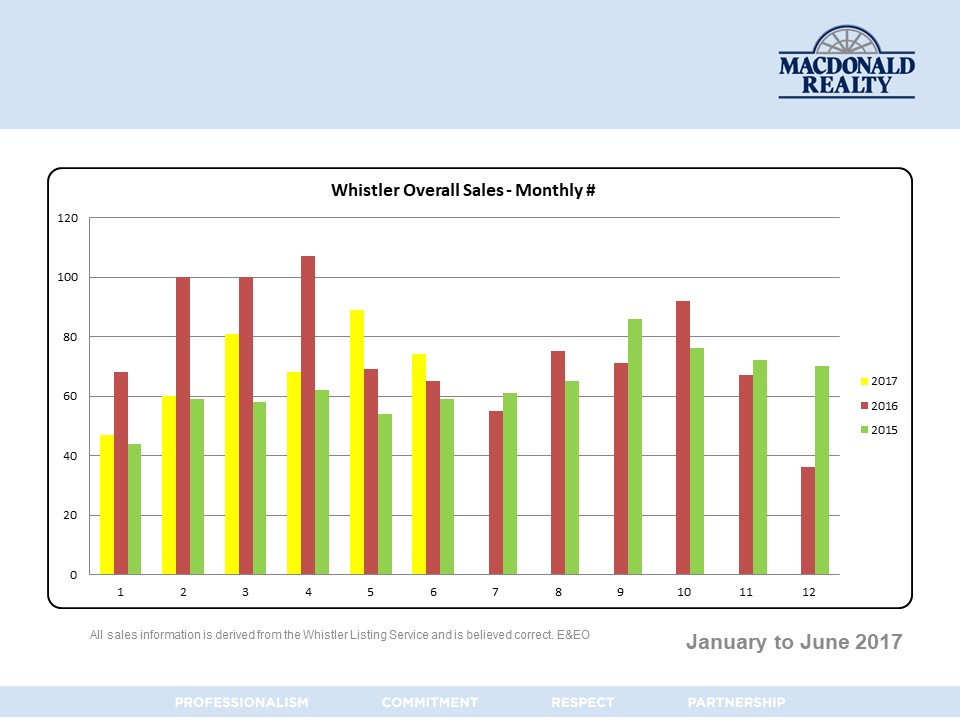
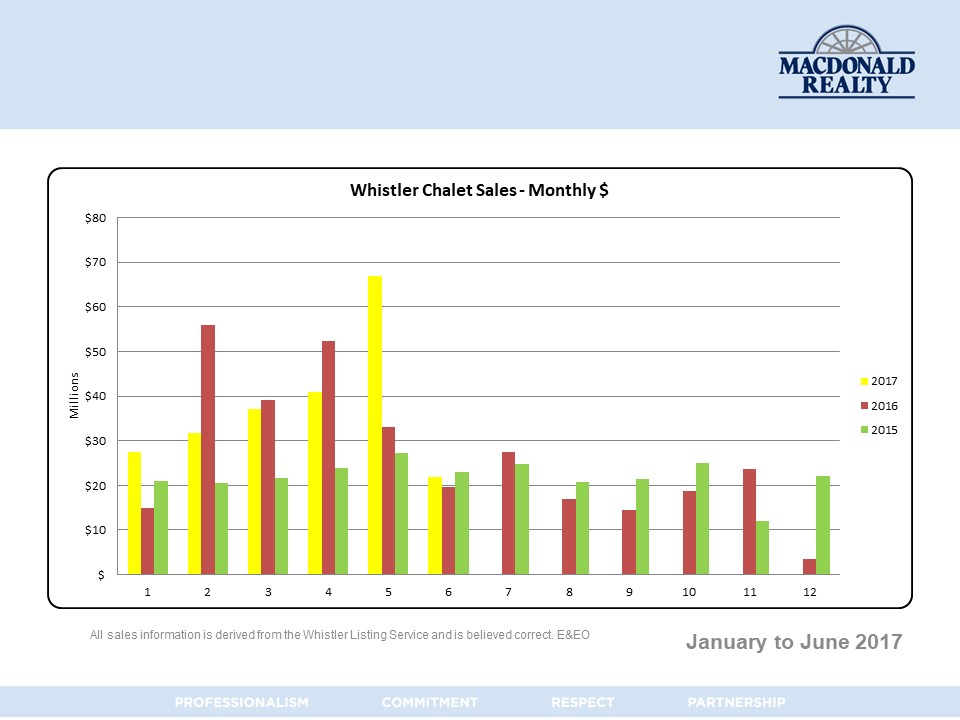
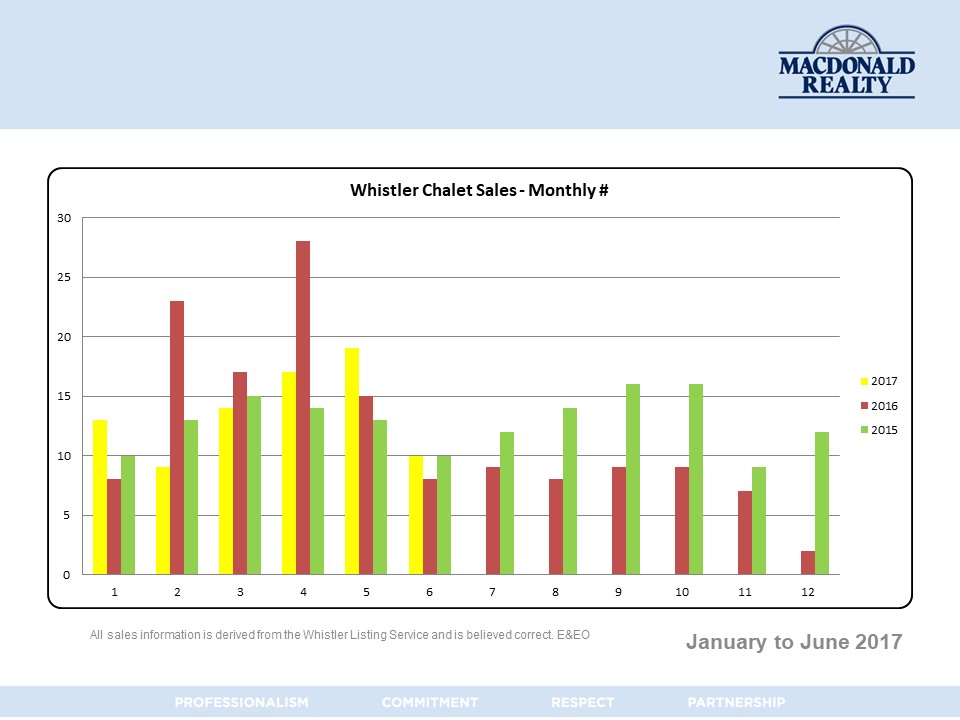
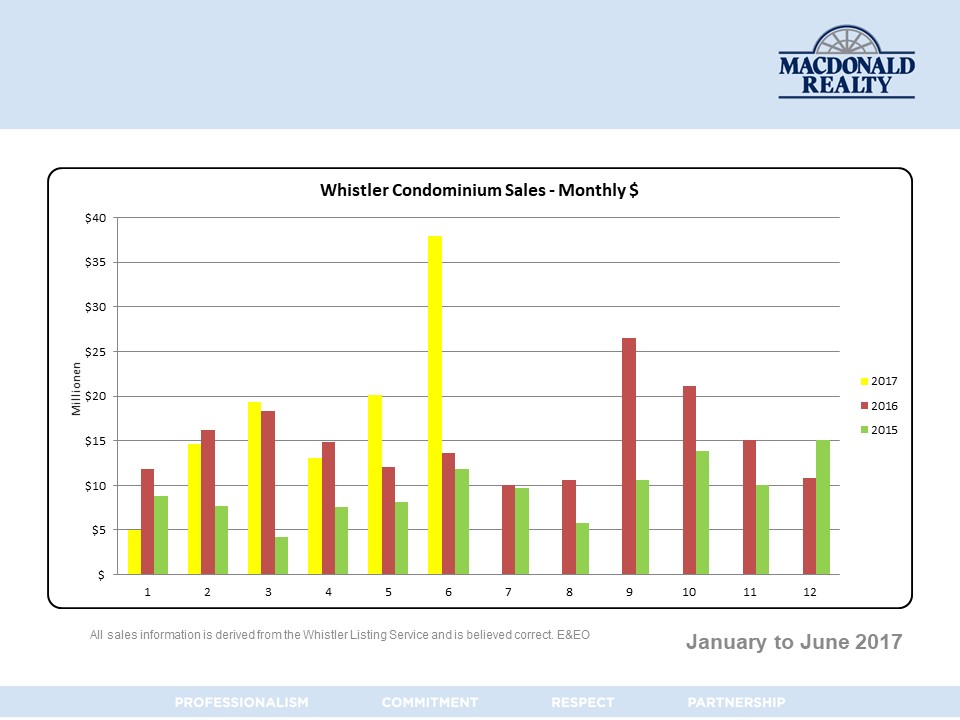
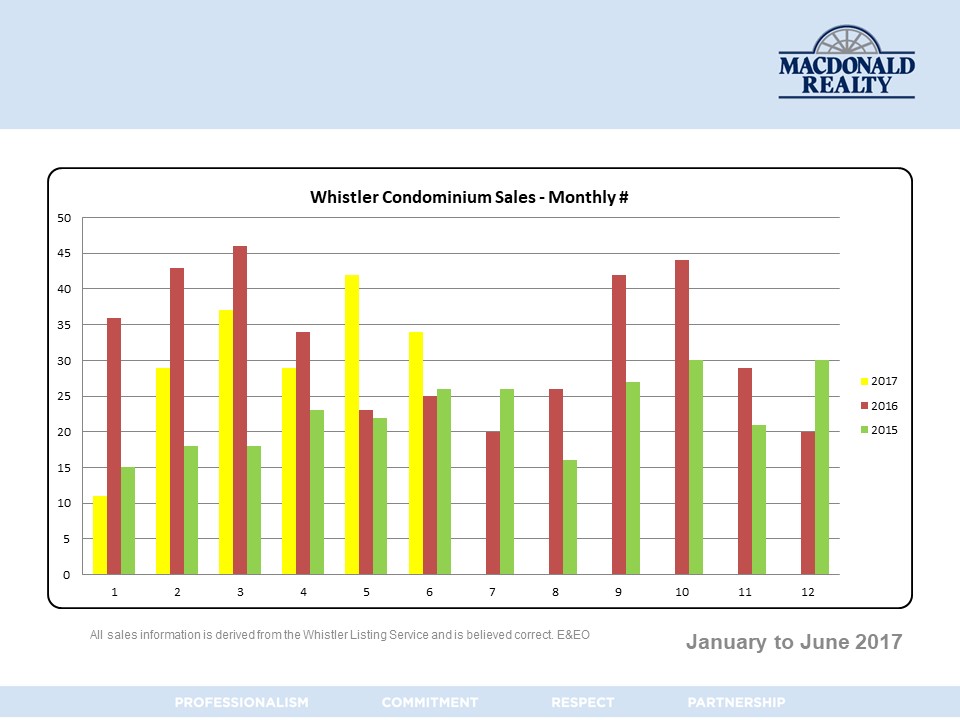
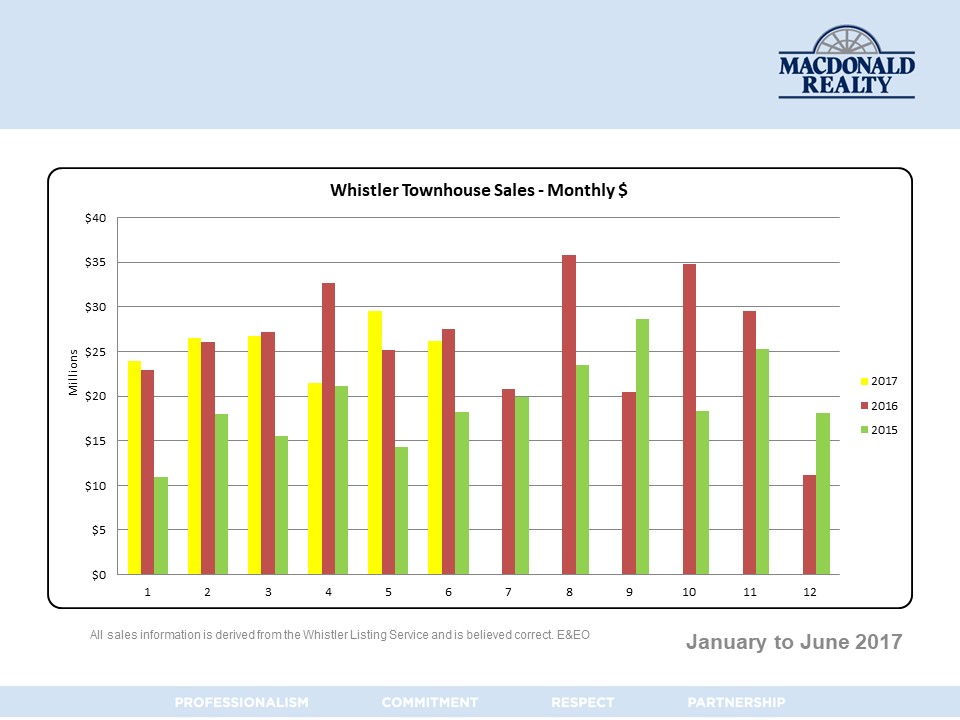
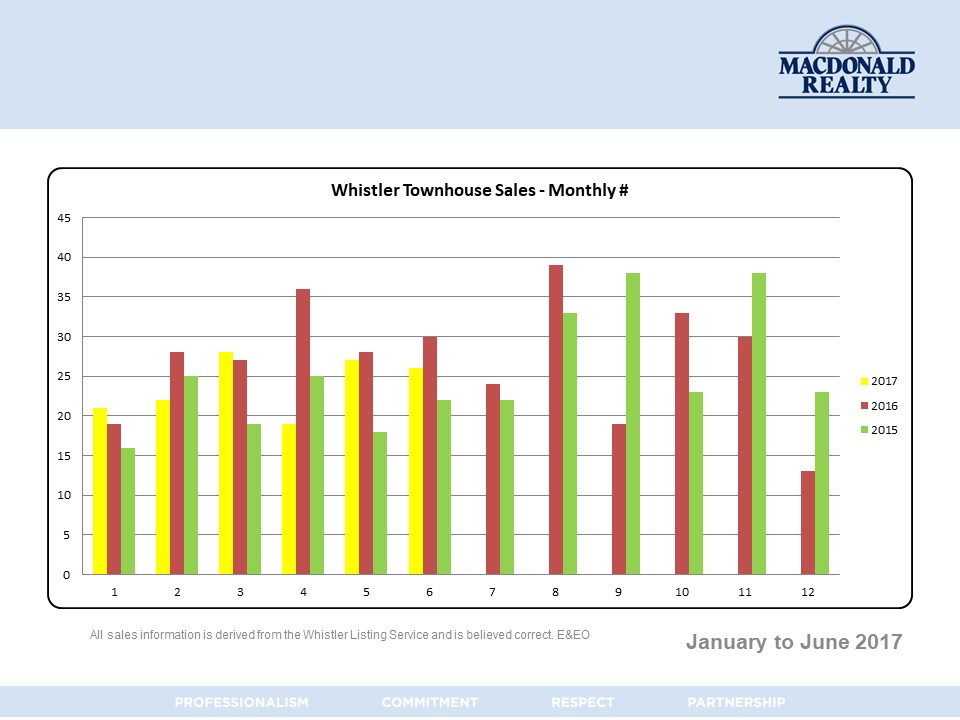
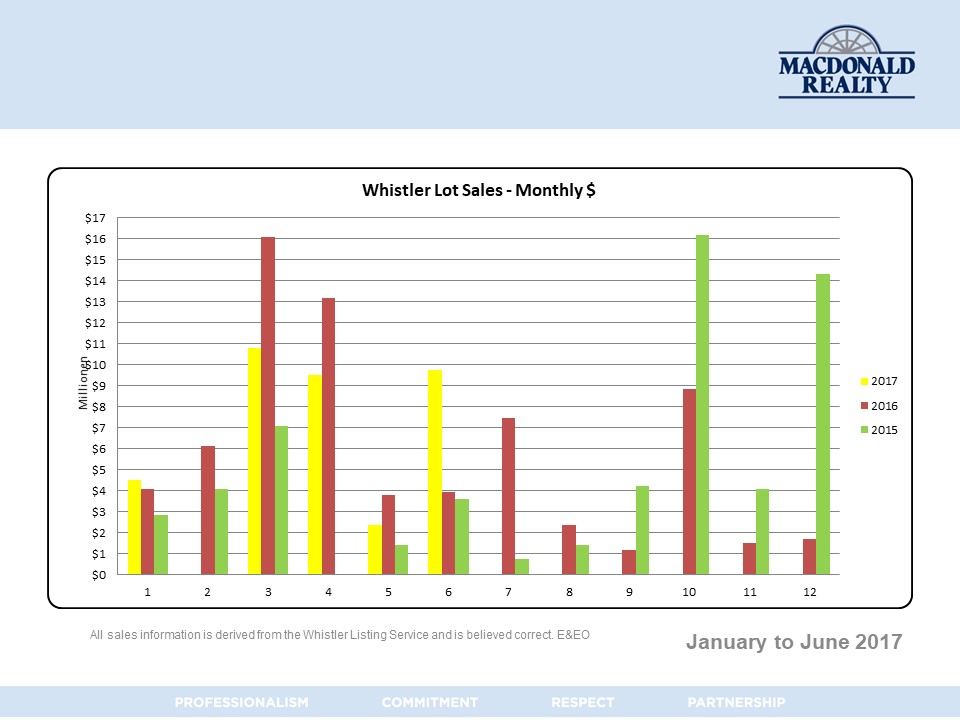
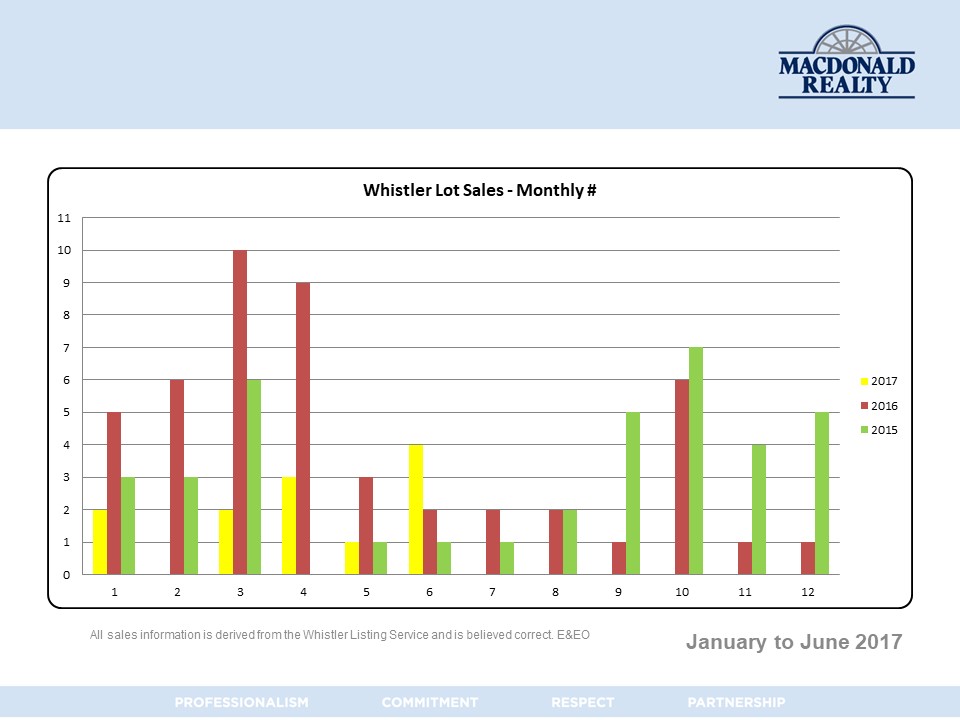
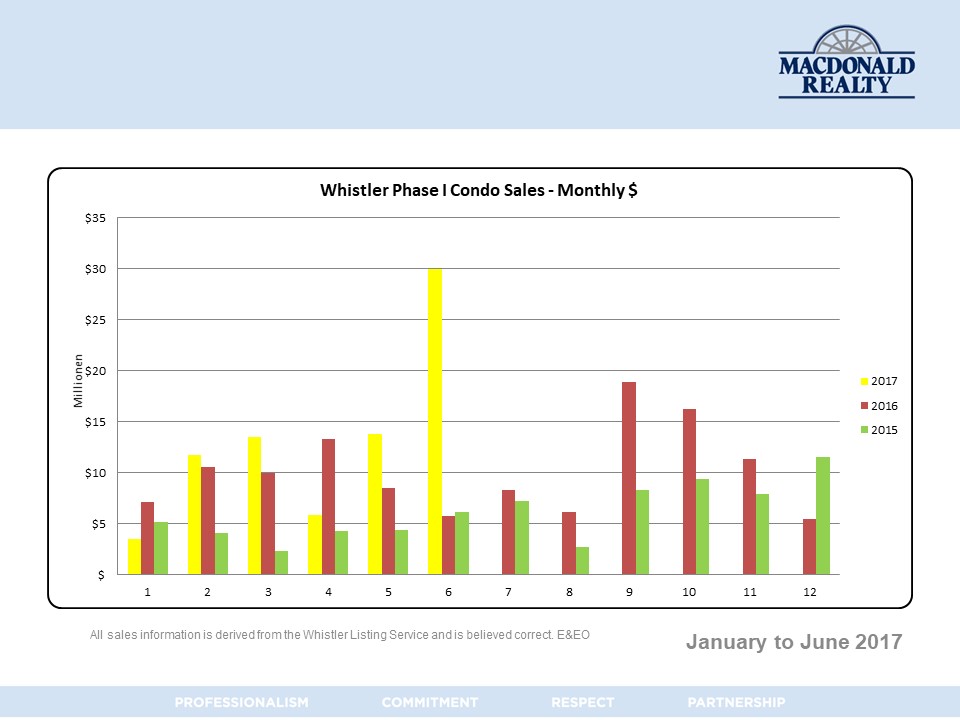
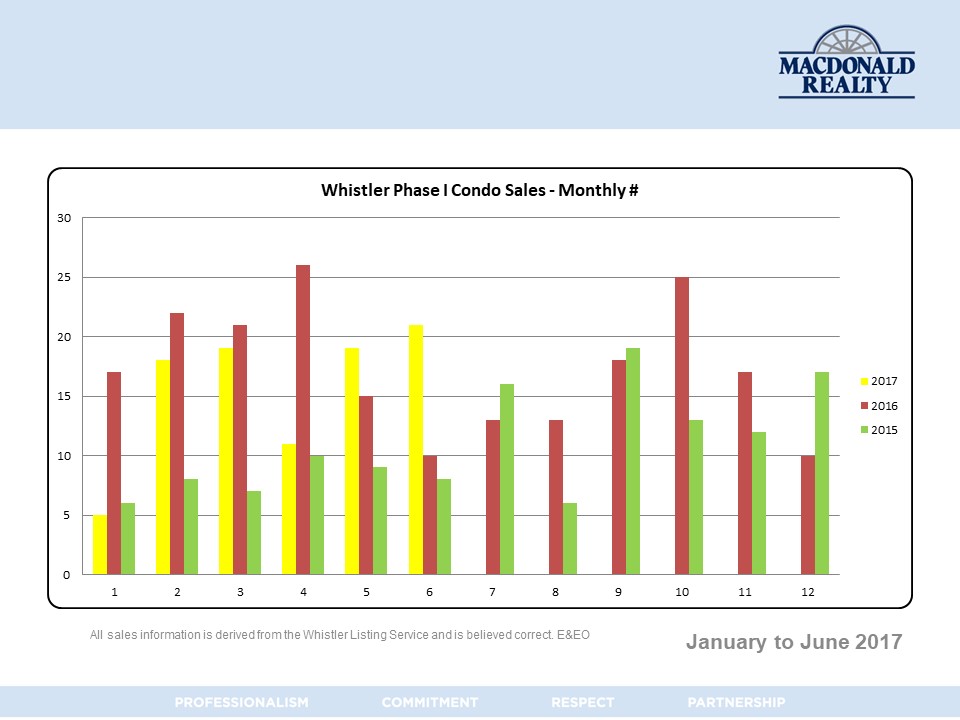
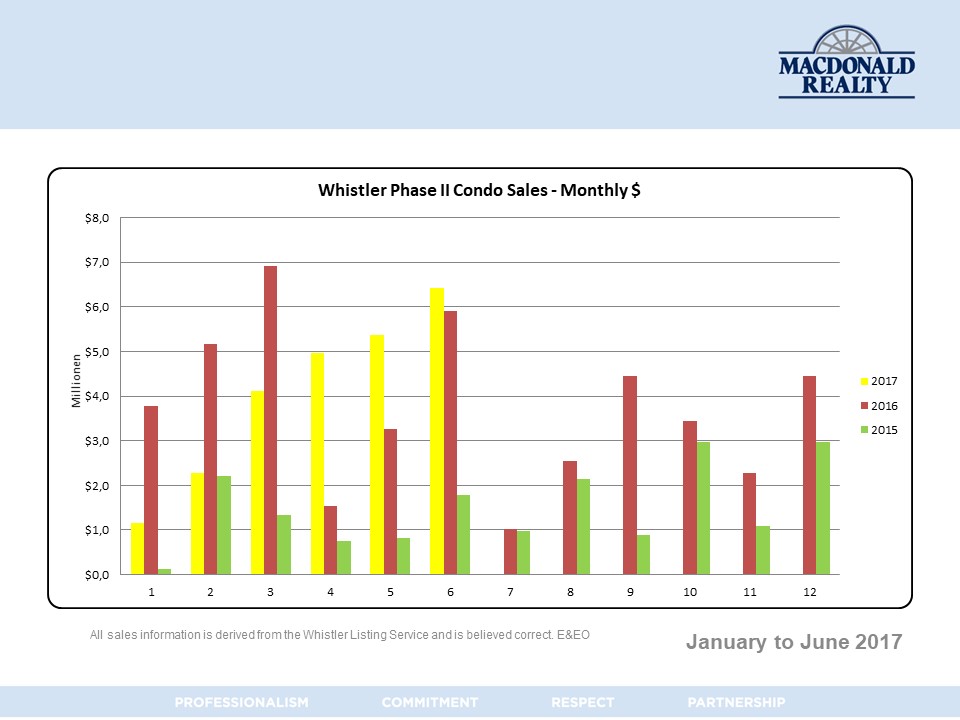
Whistler January to July 2017 Real Estate Statistics
See the full statistics on our Blog, click here.
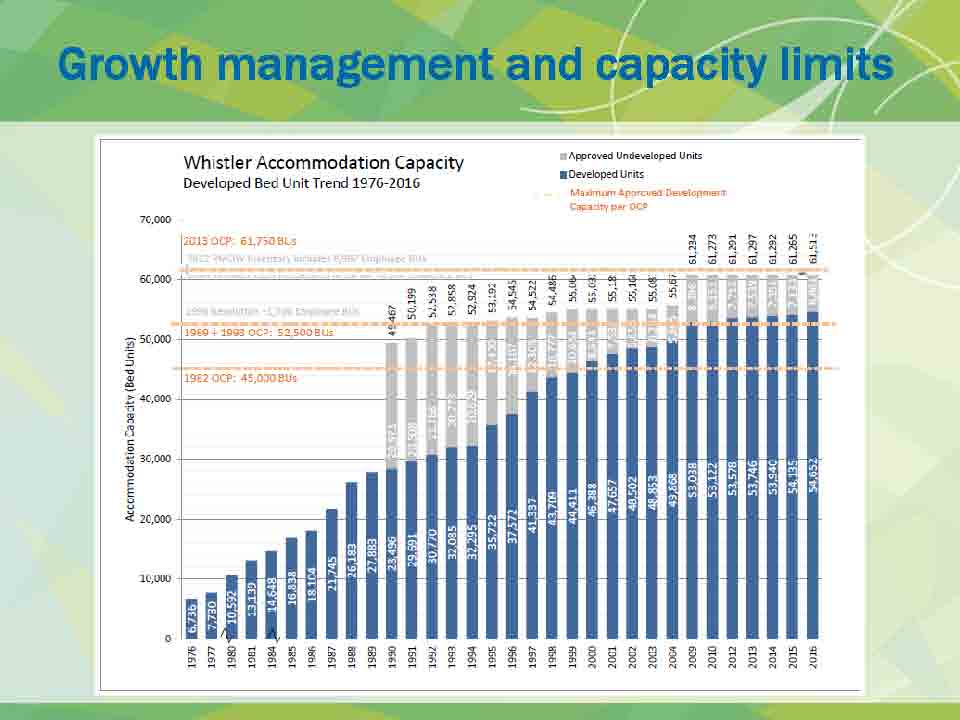
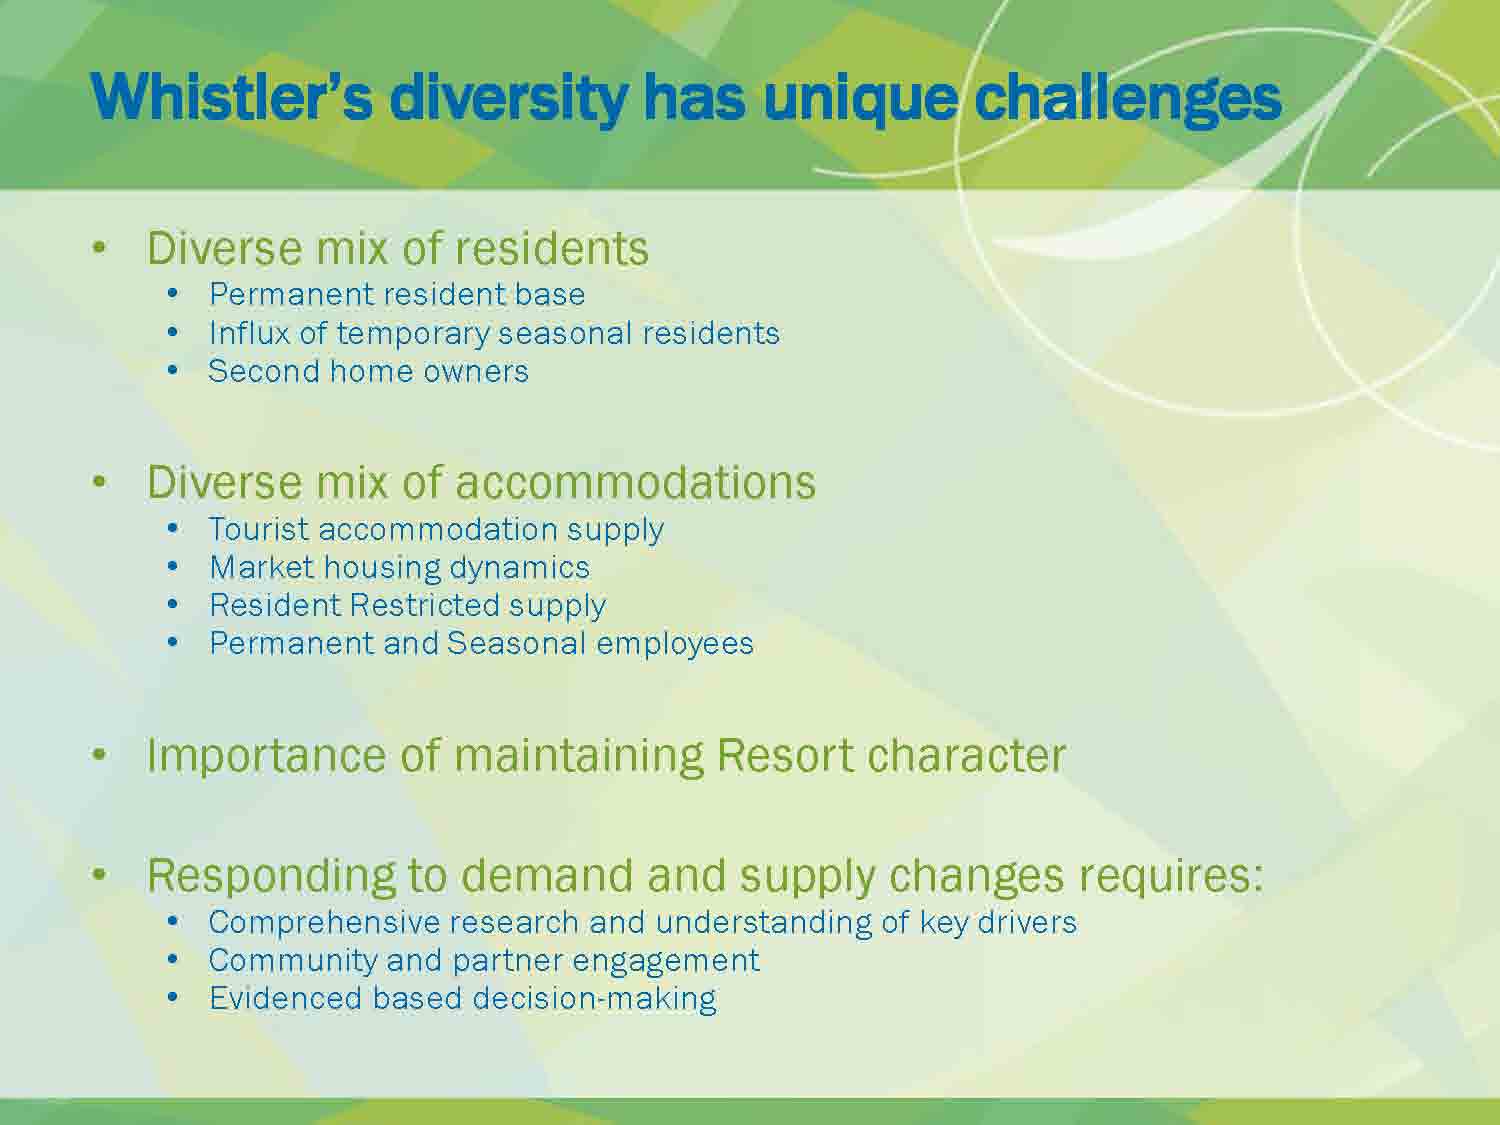
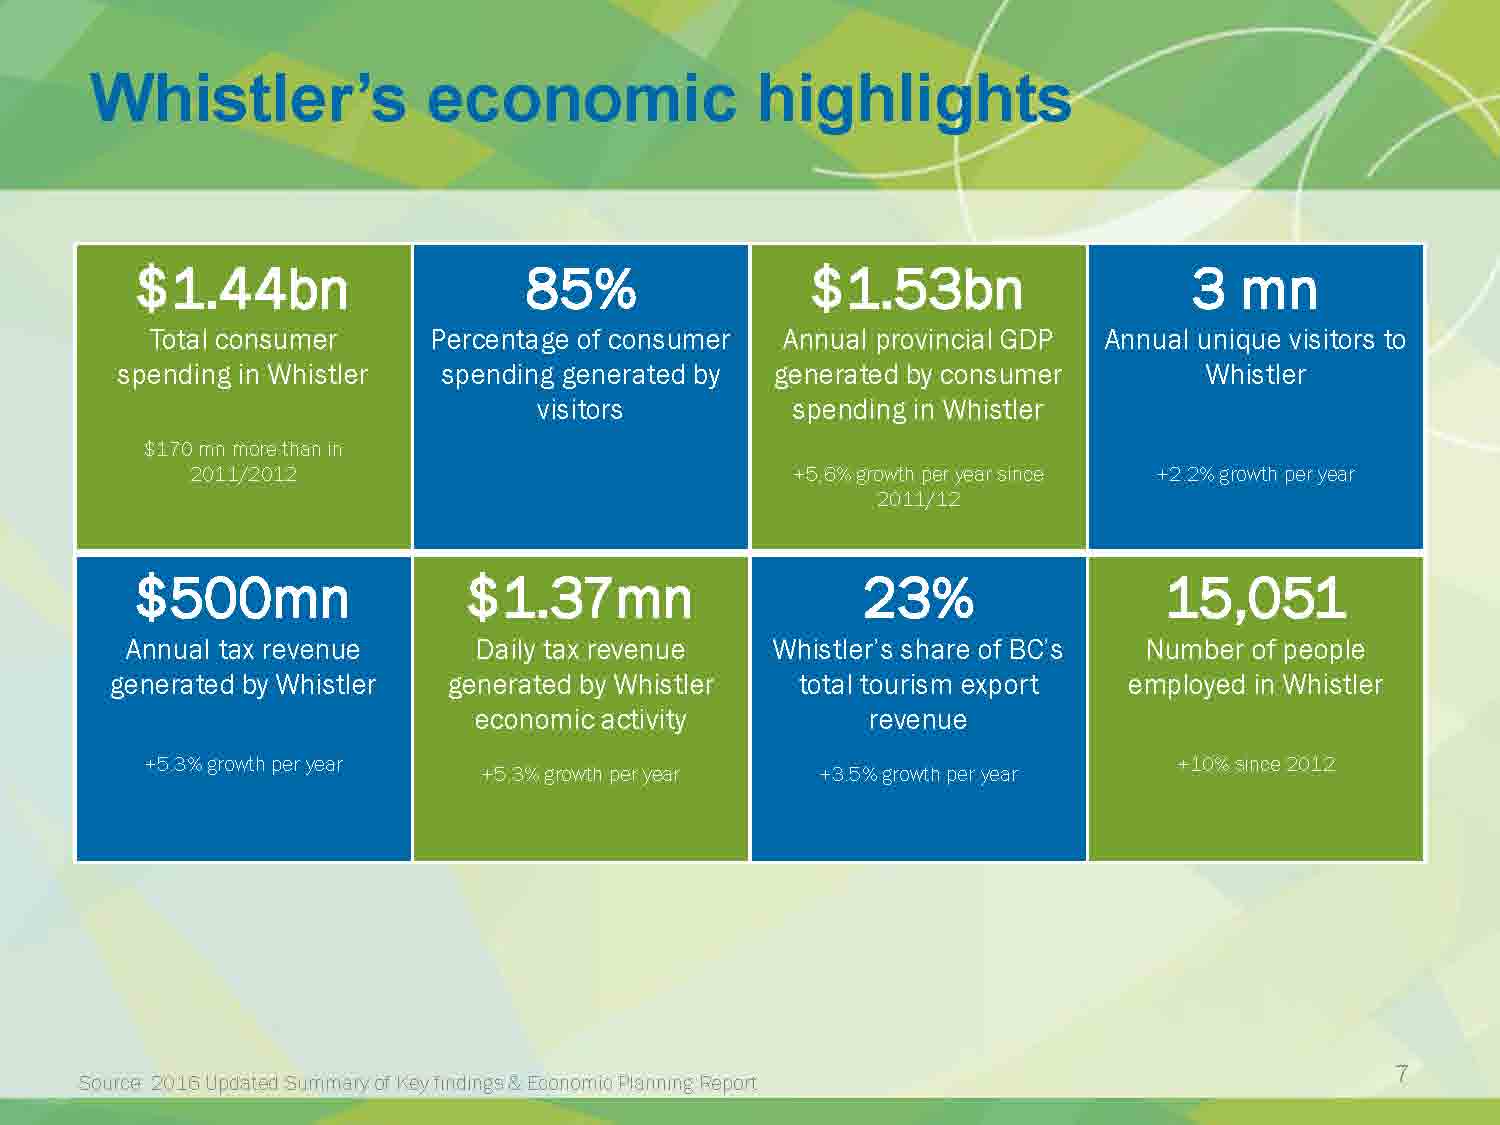
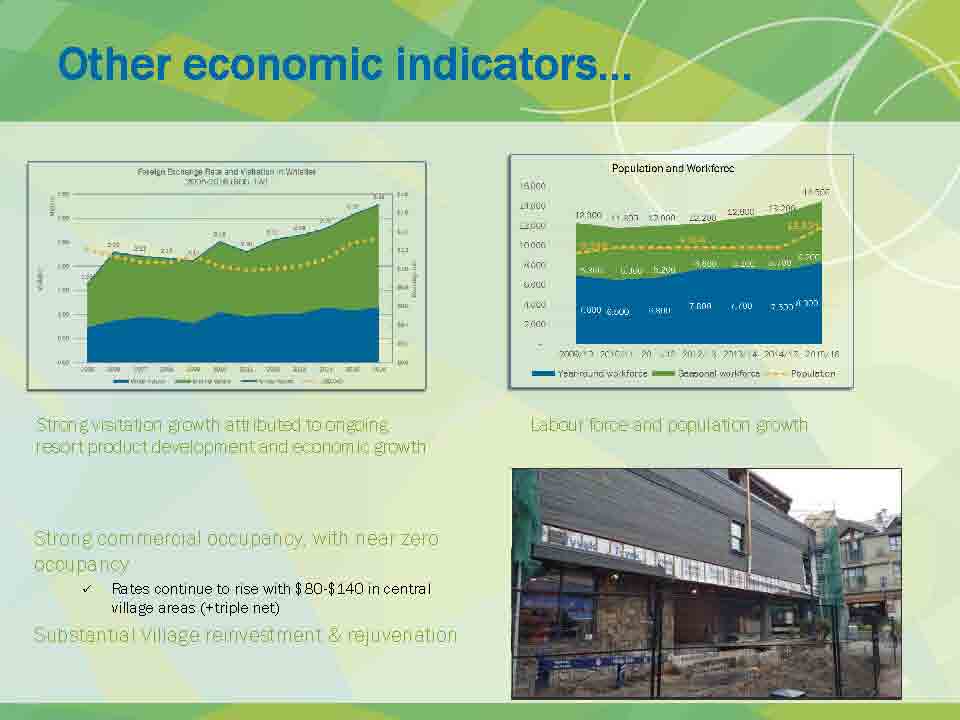
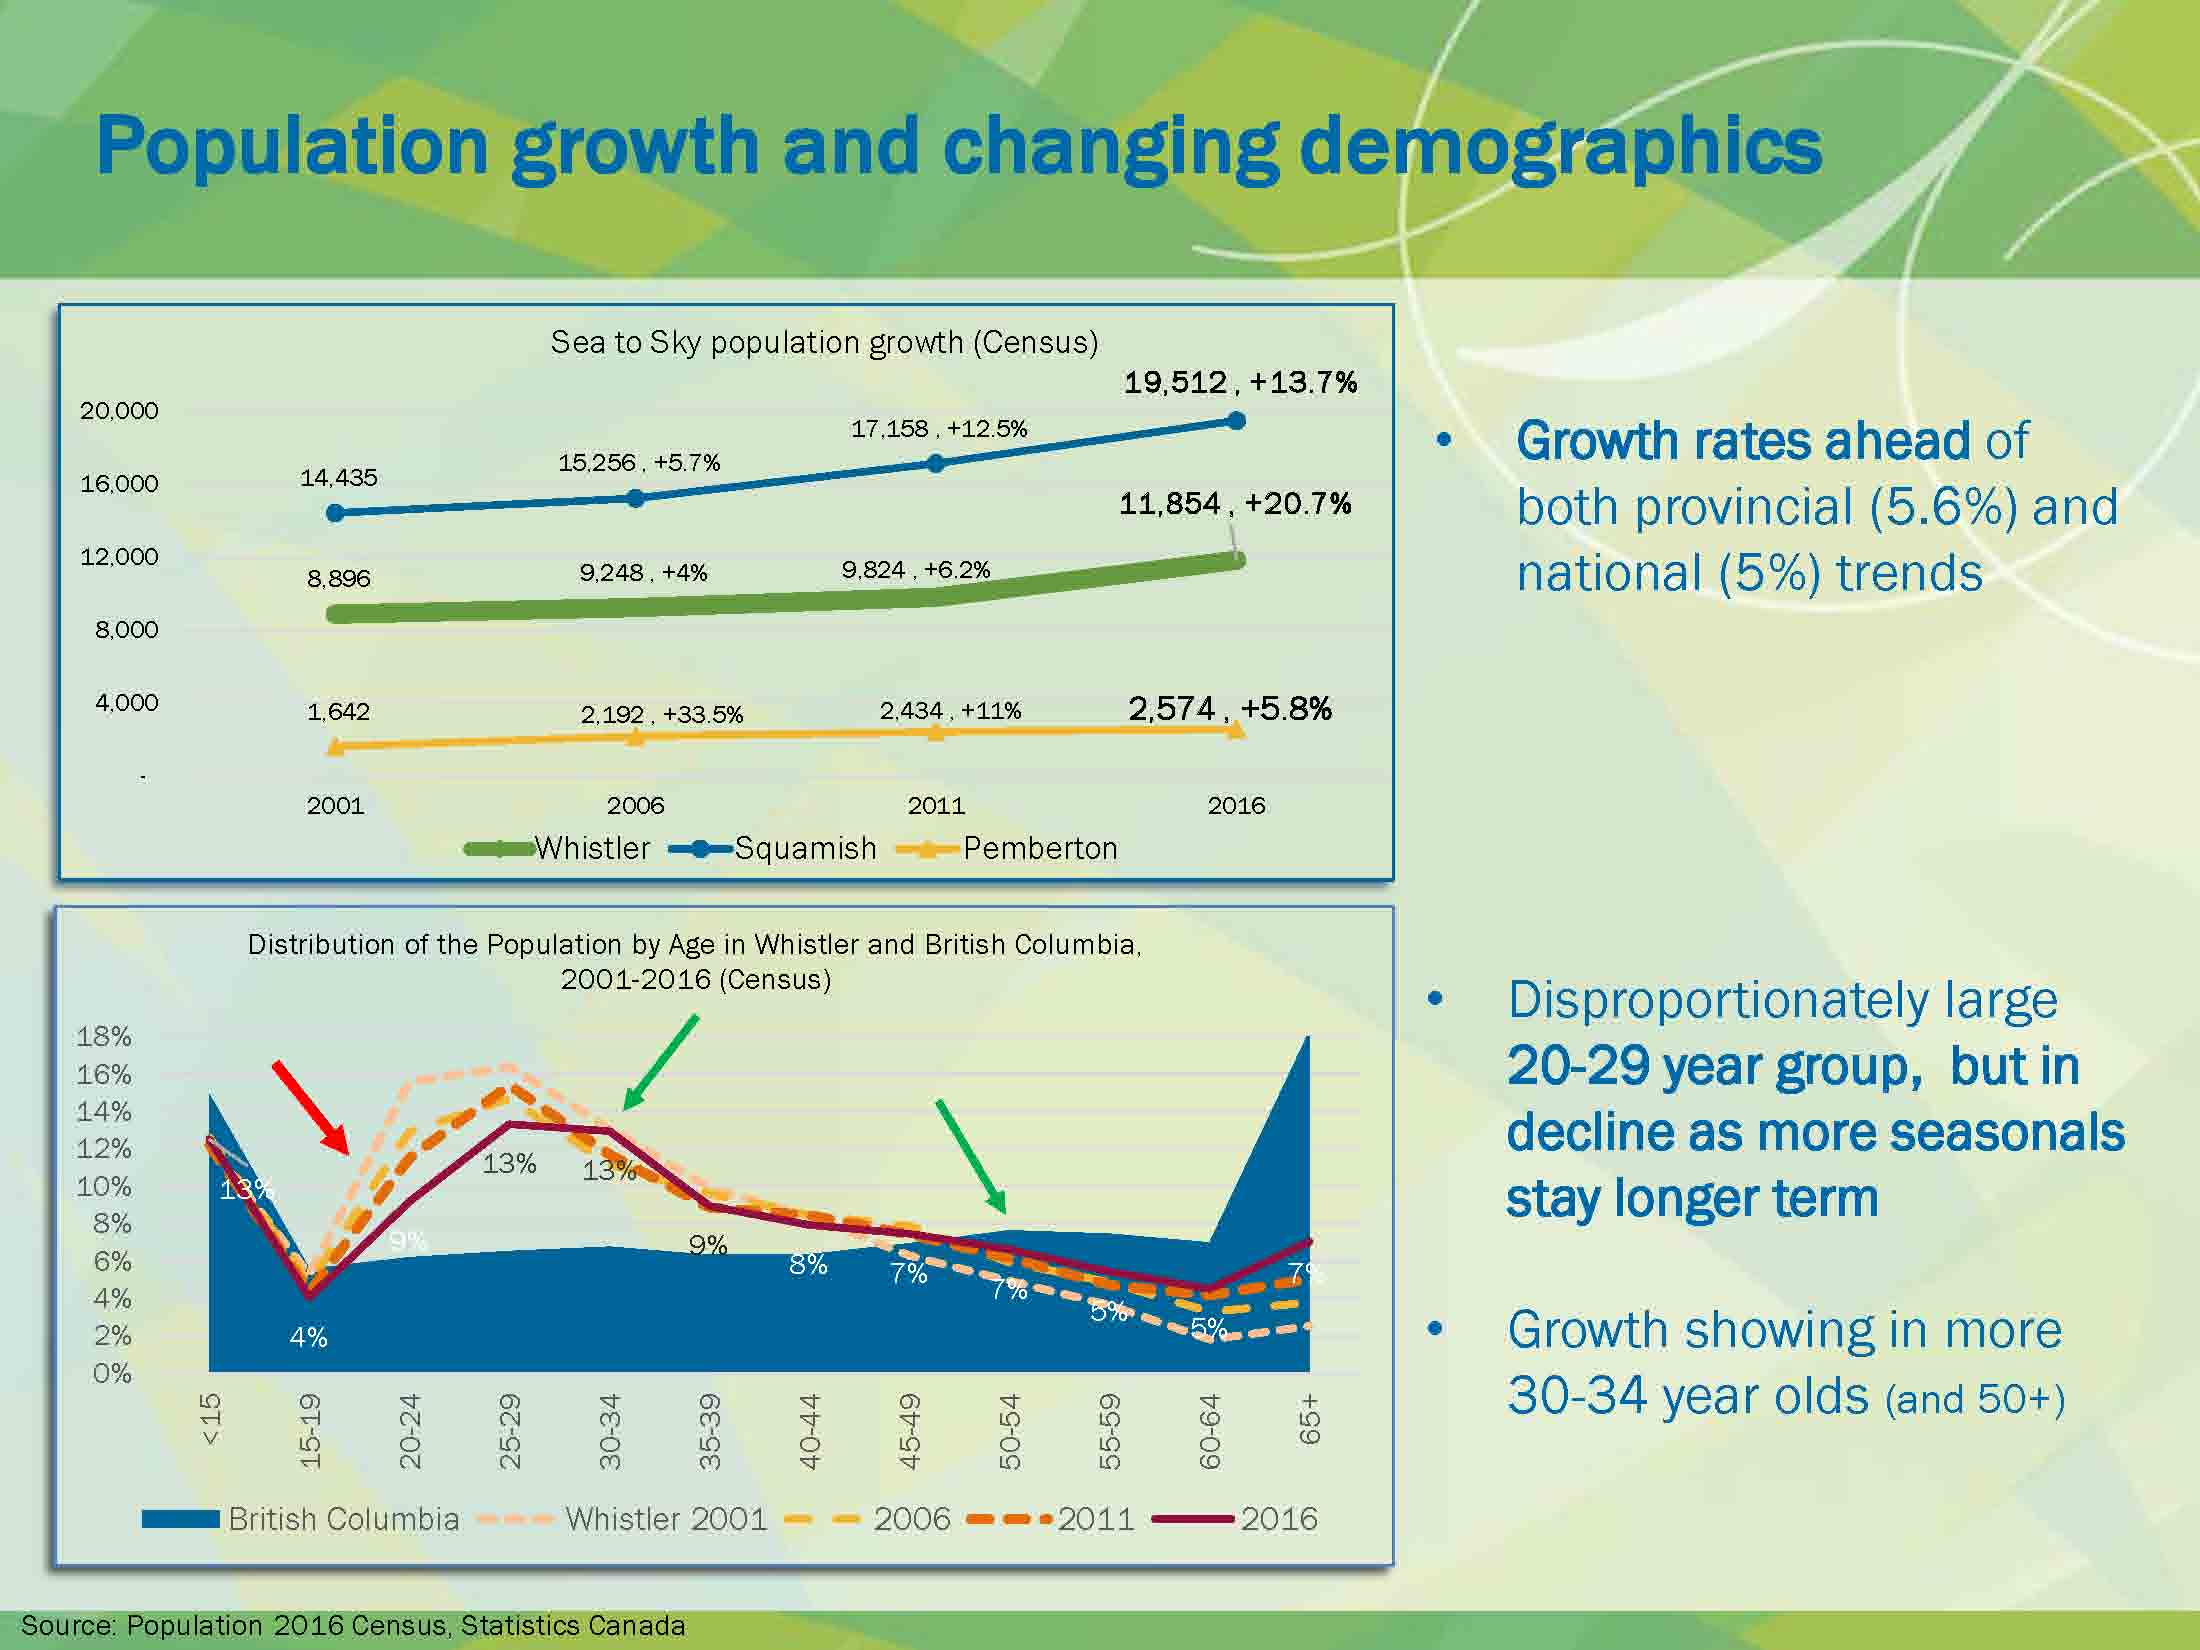
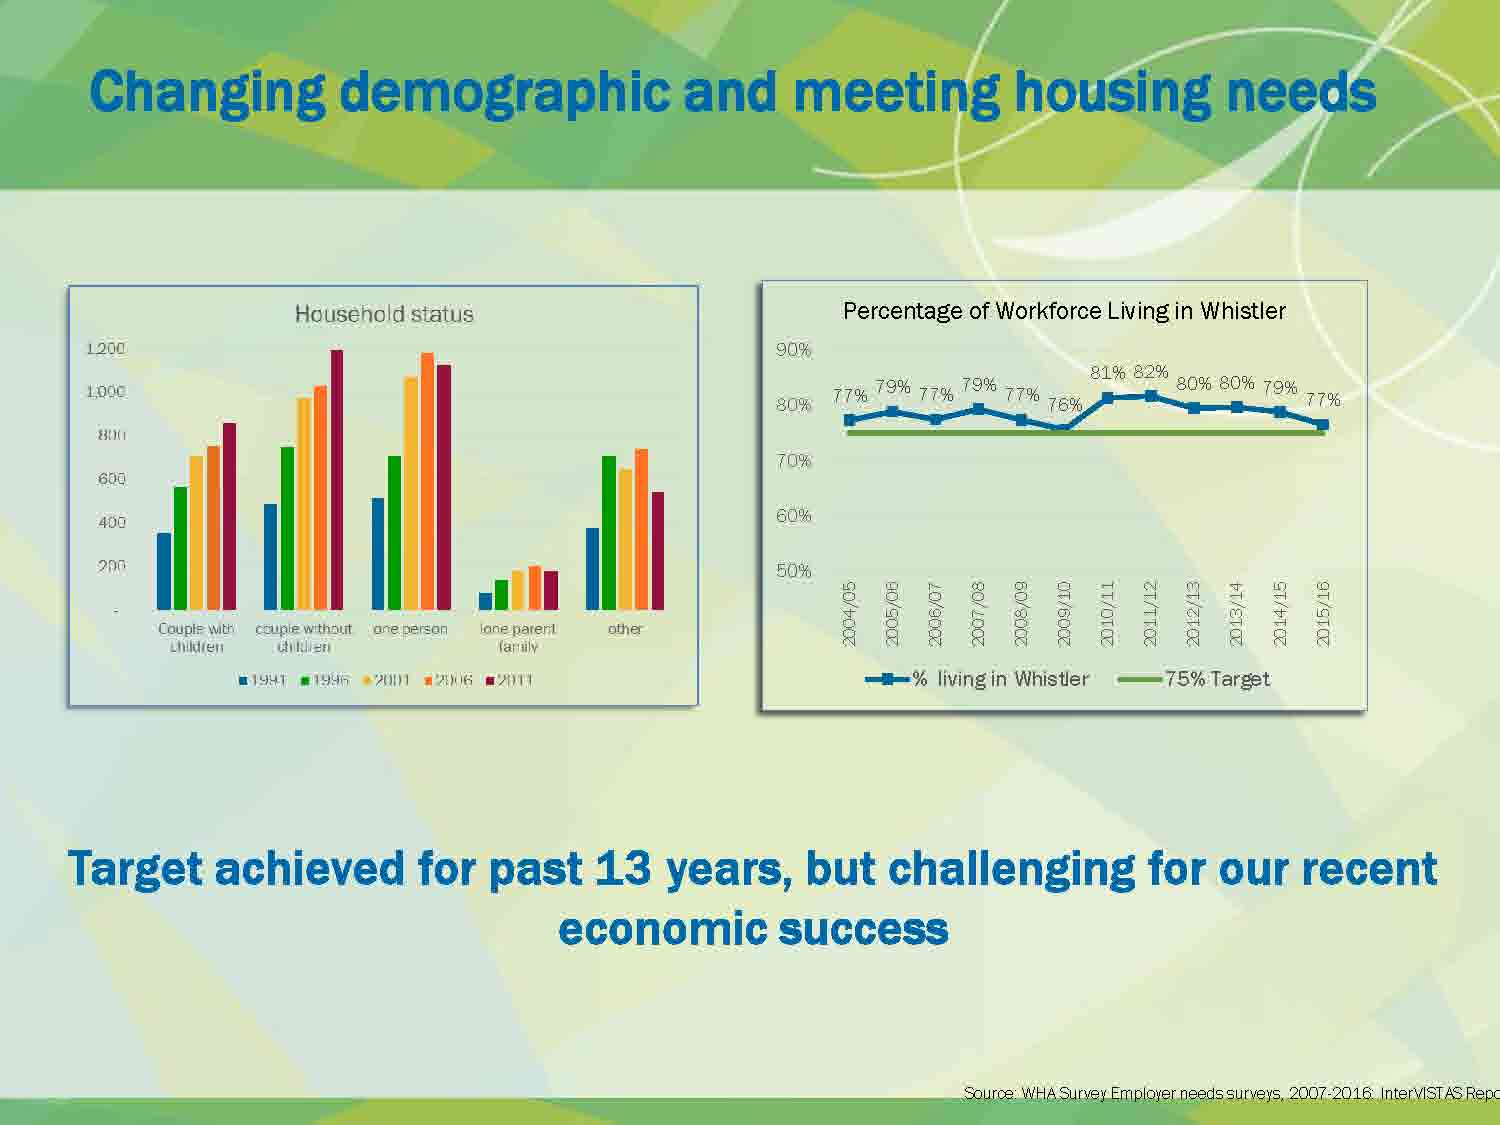
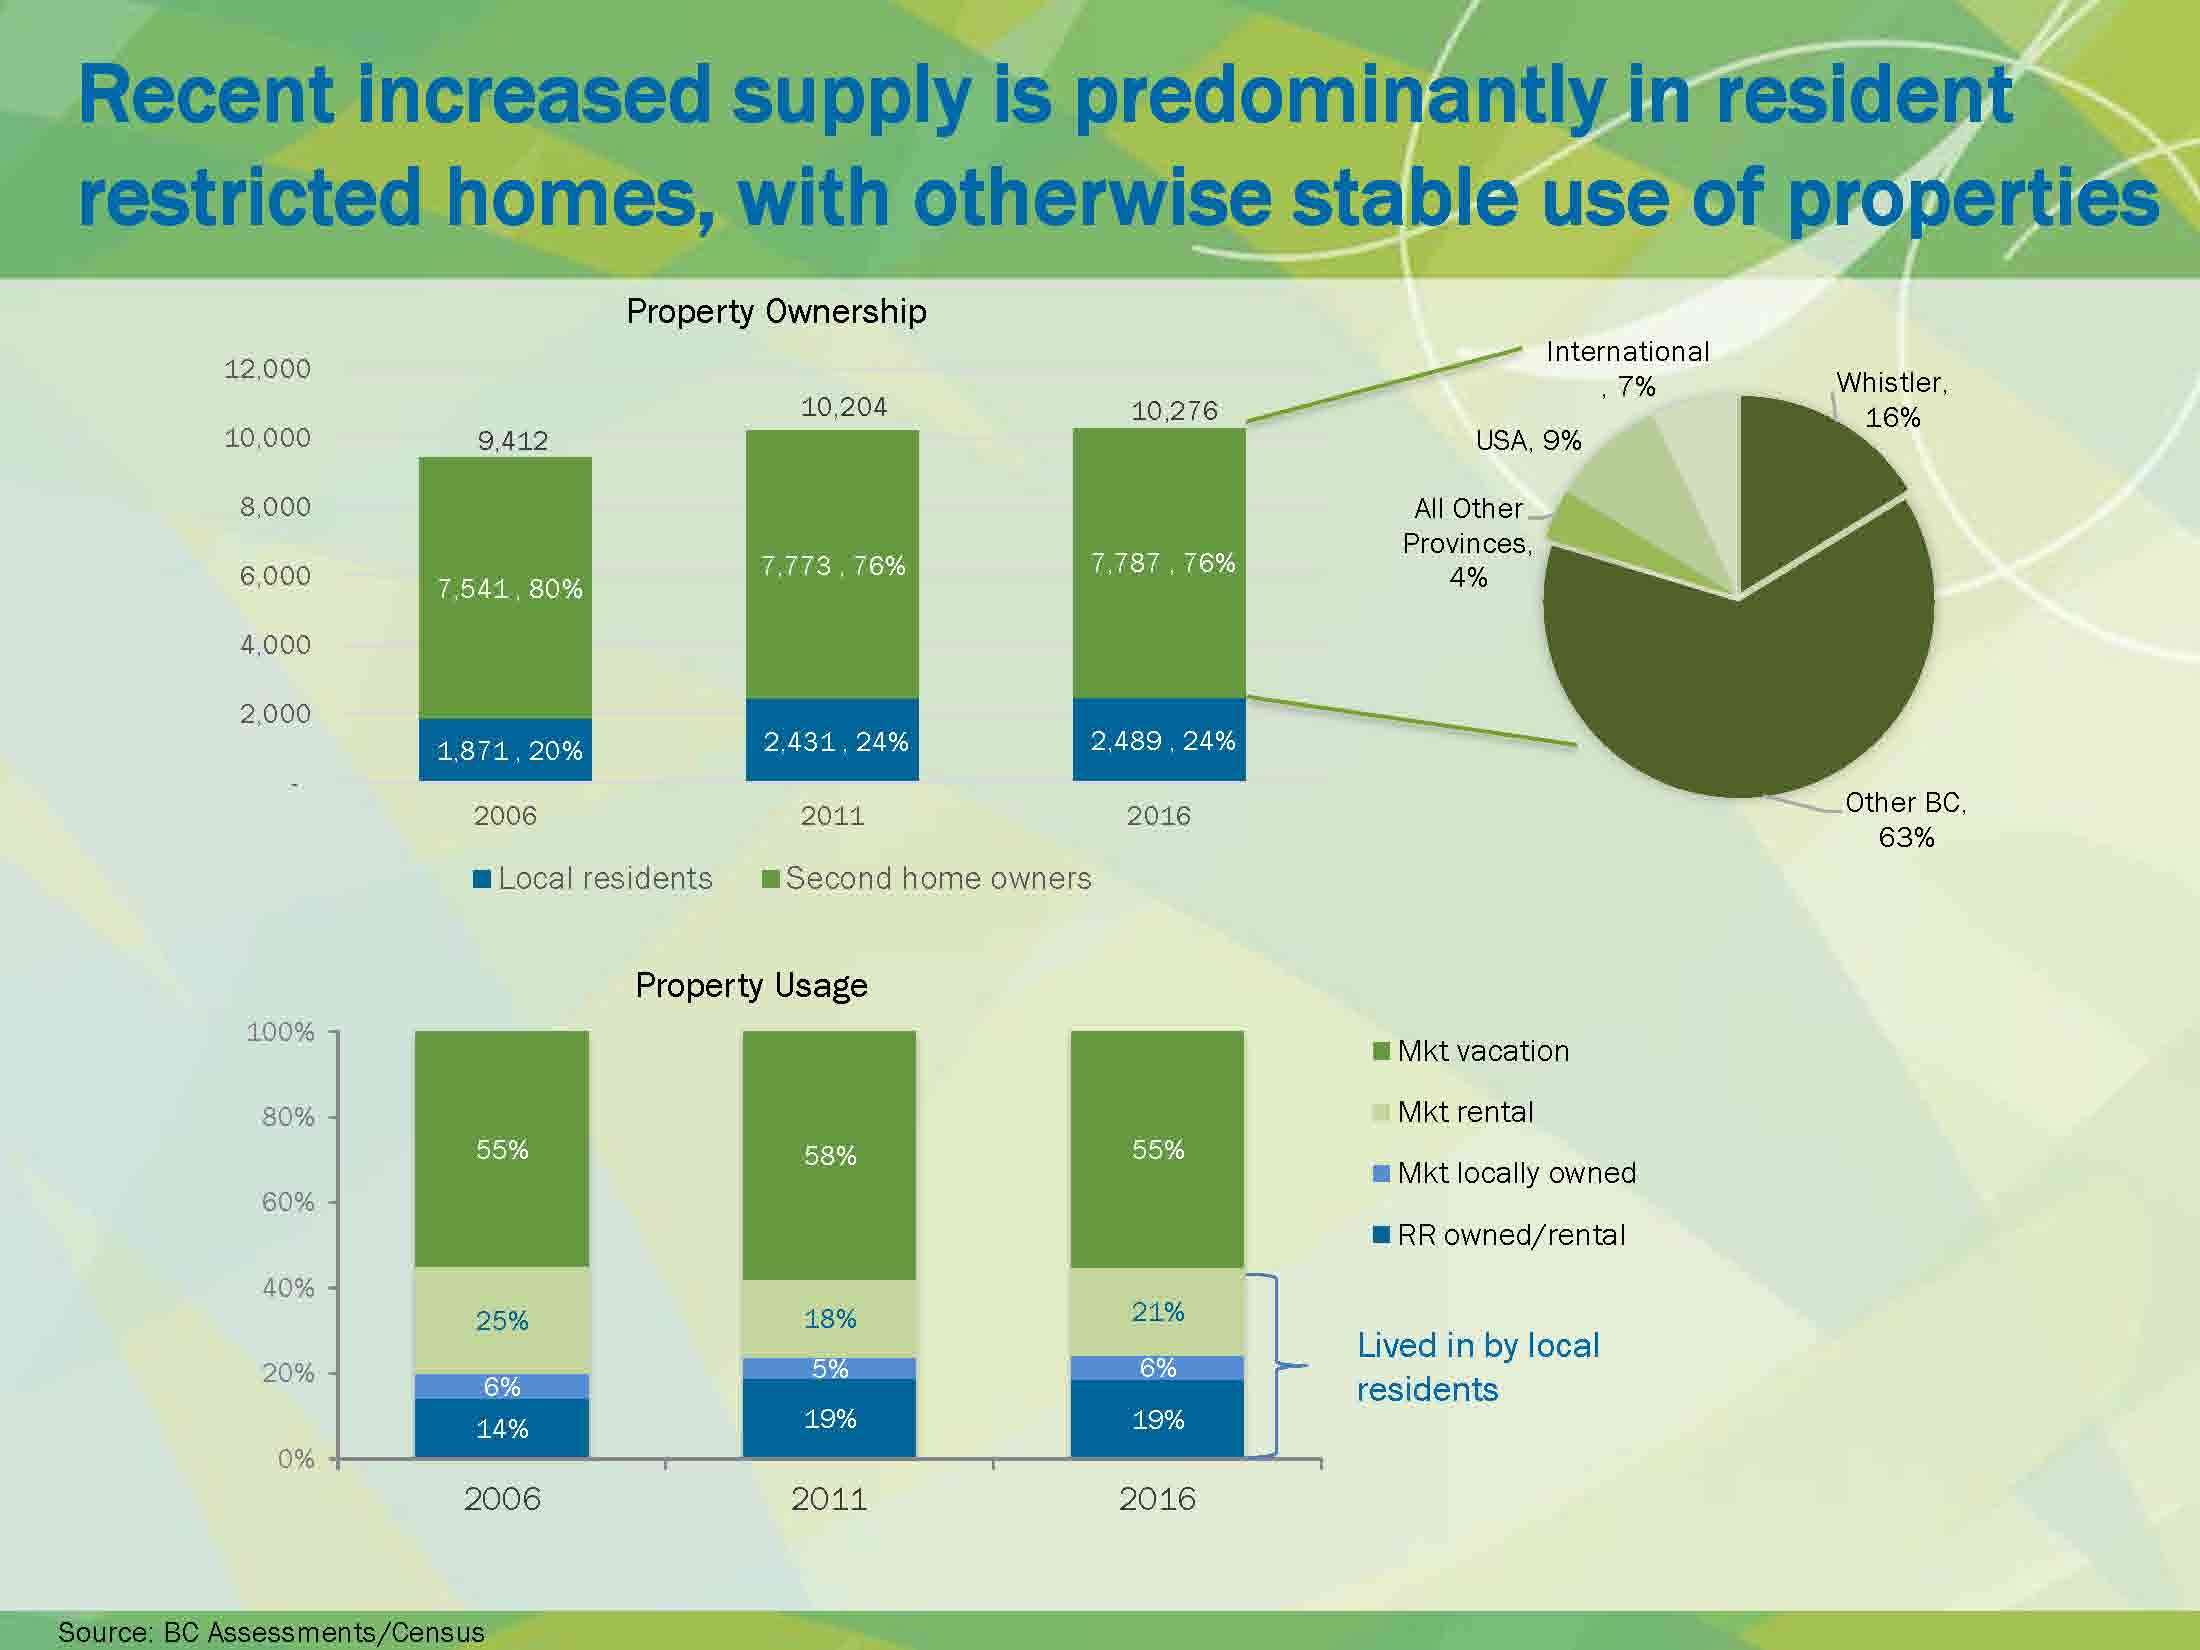
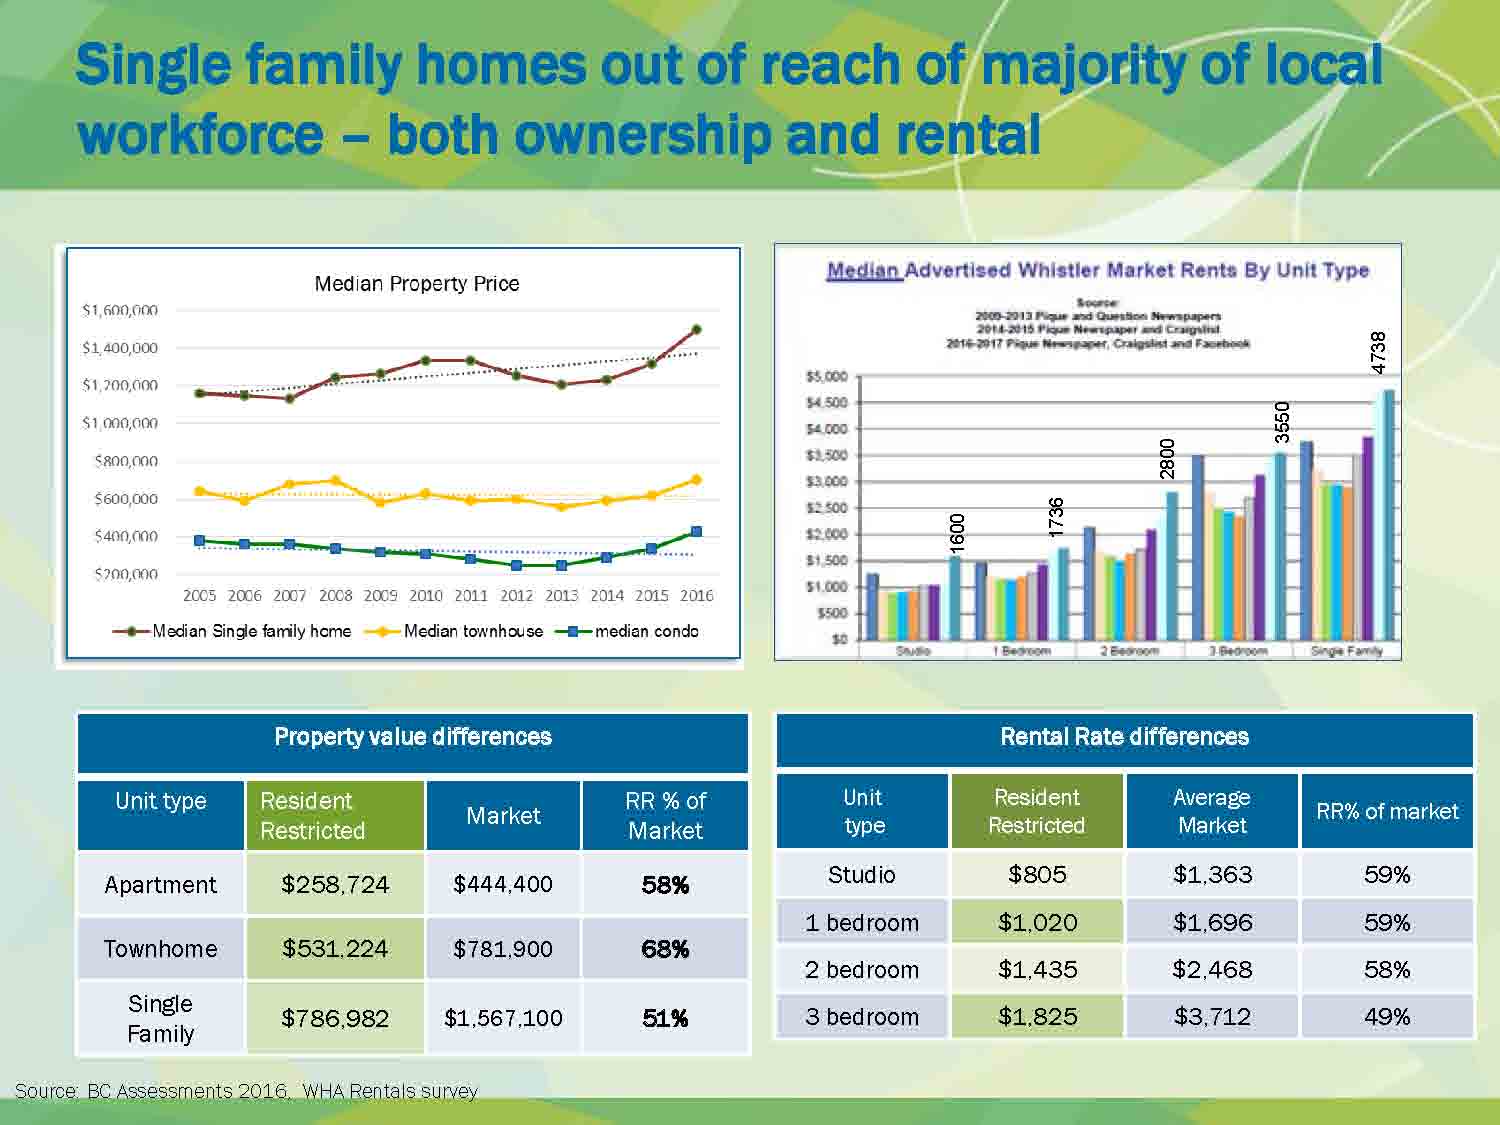
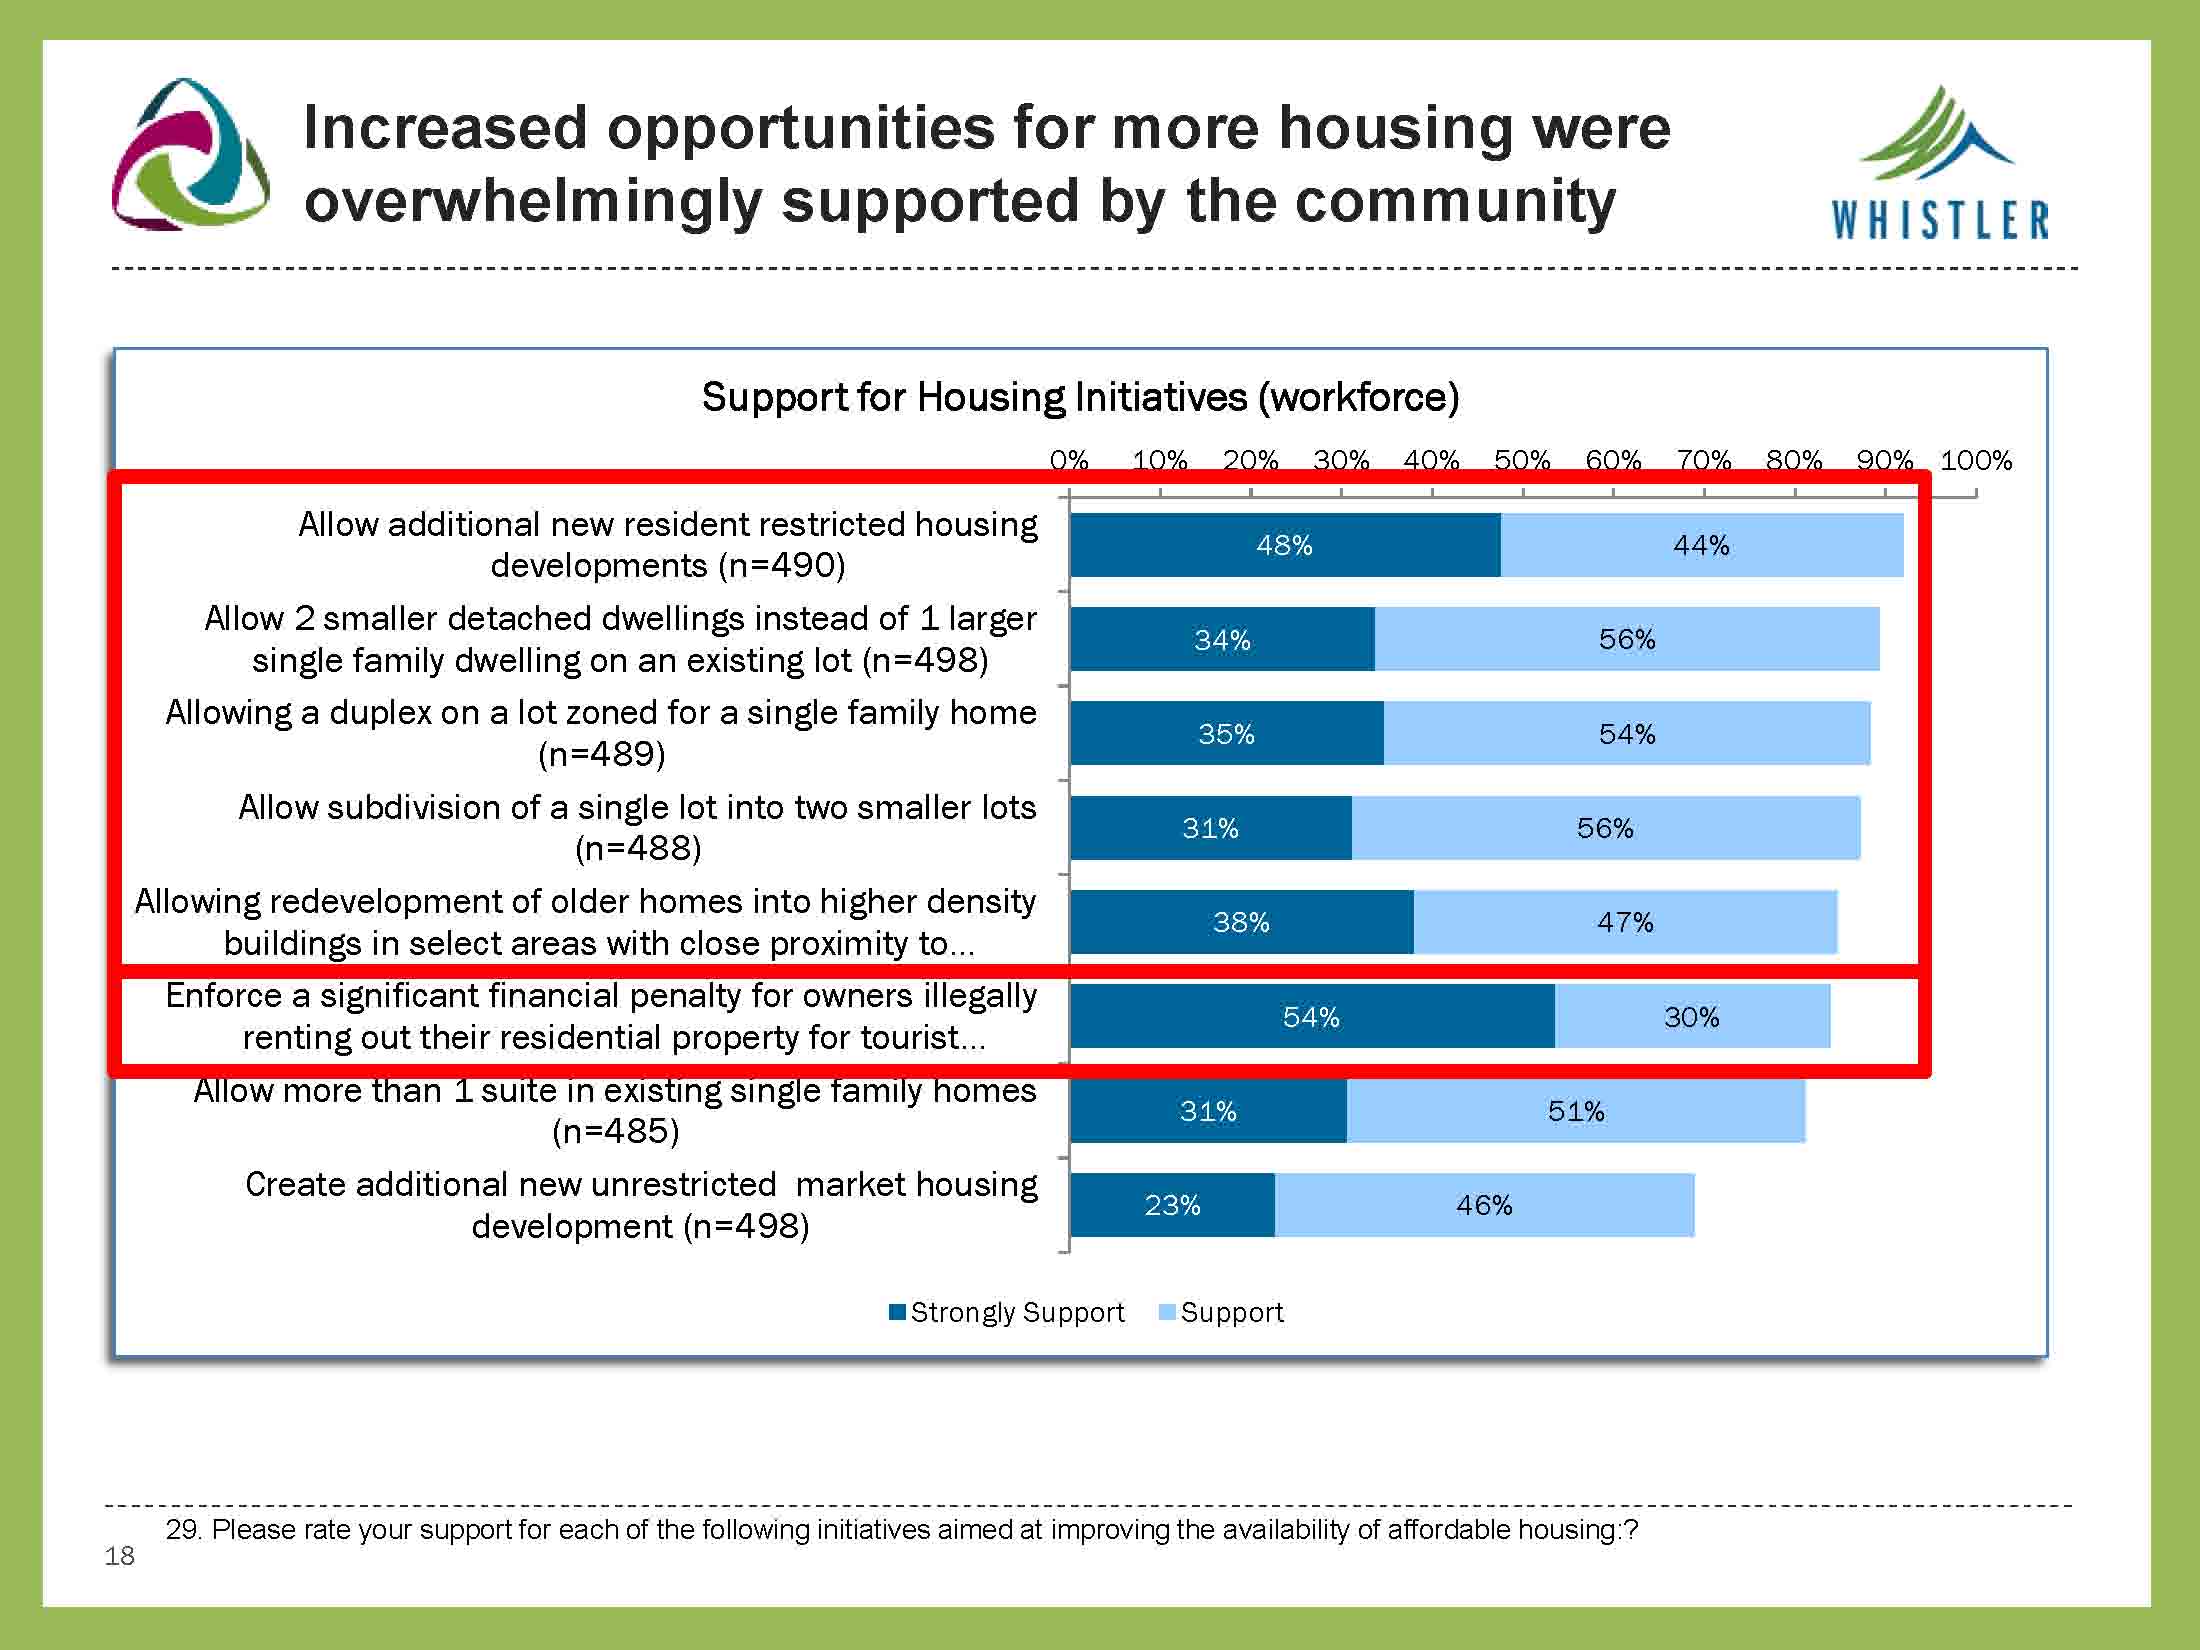
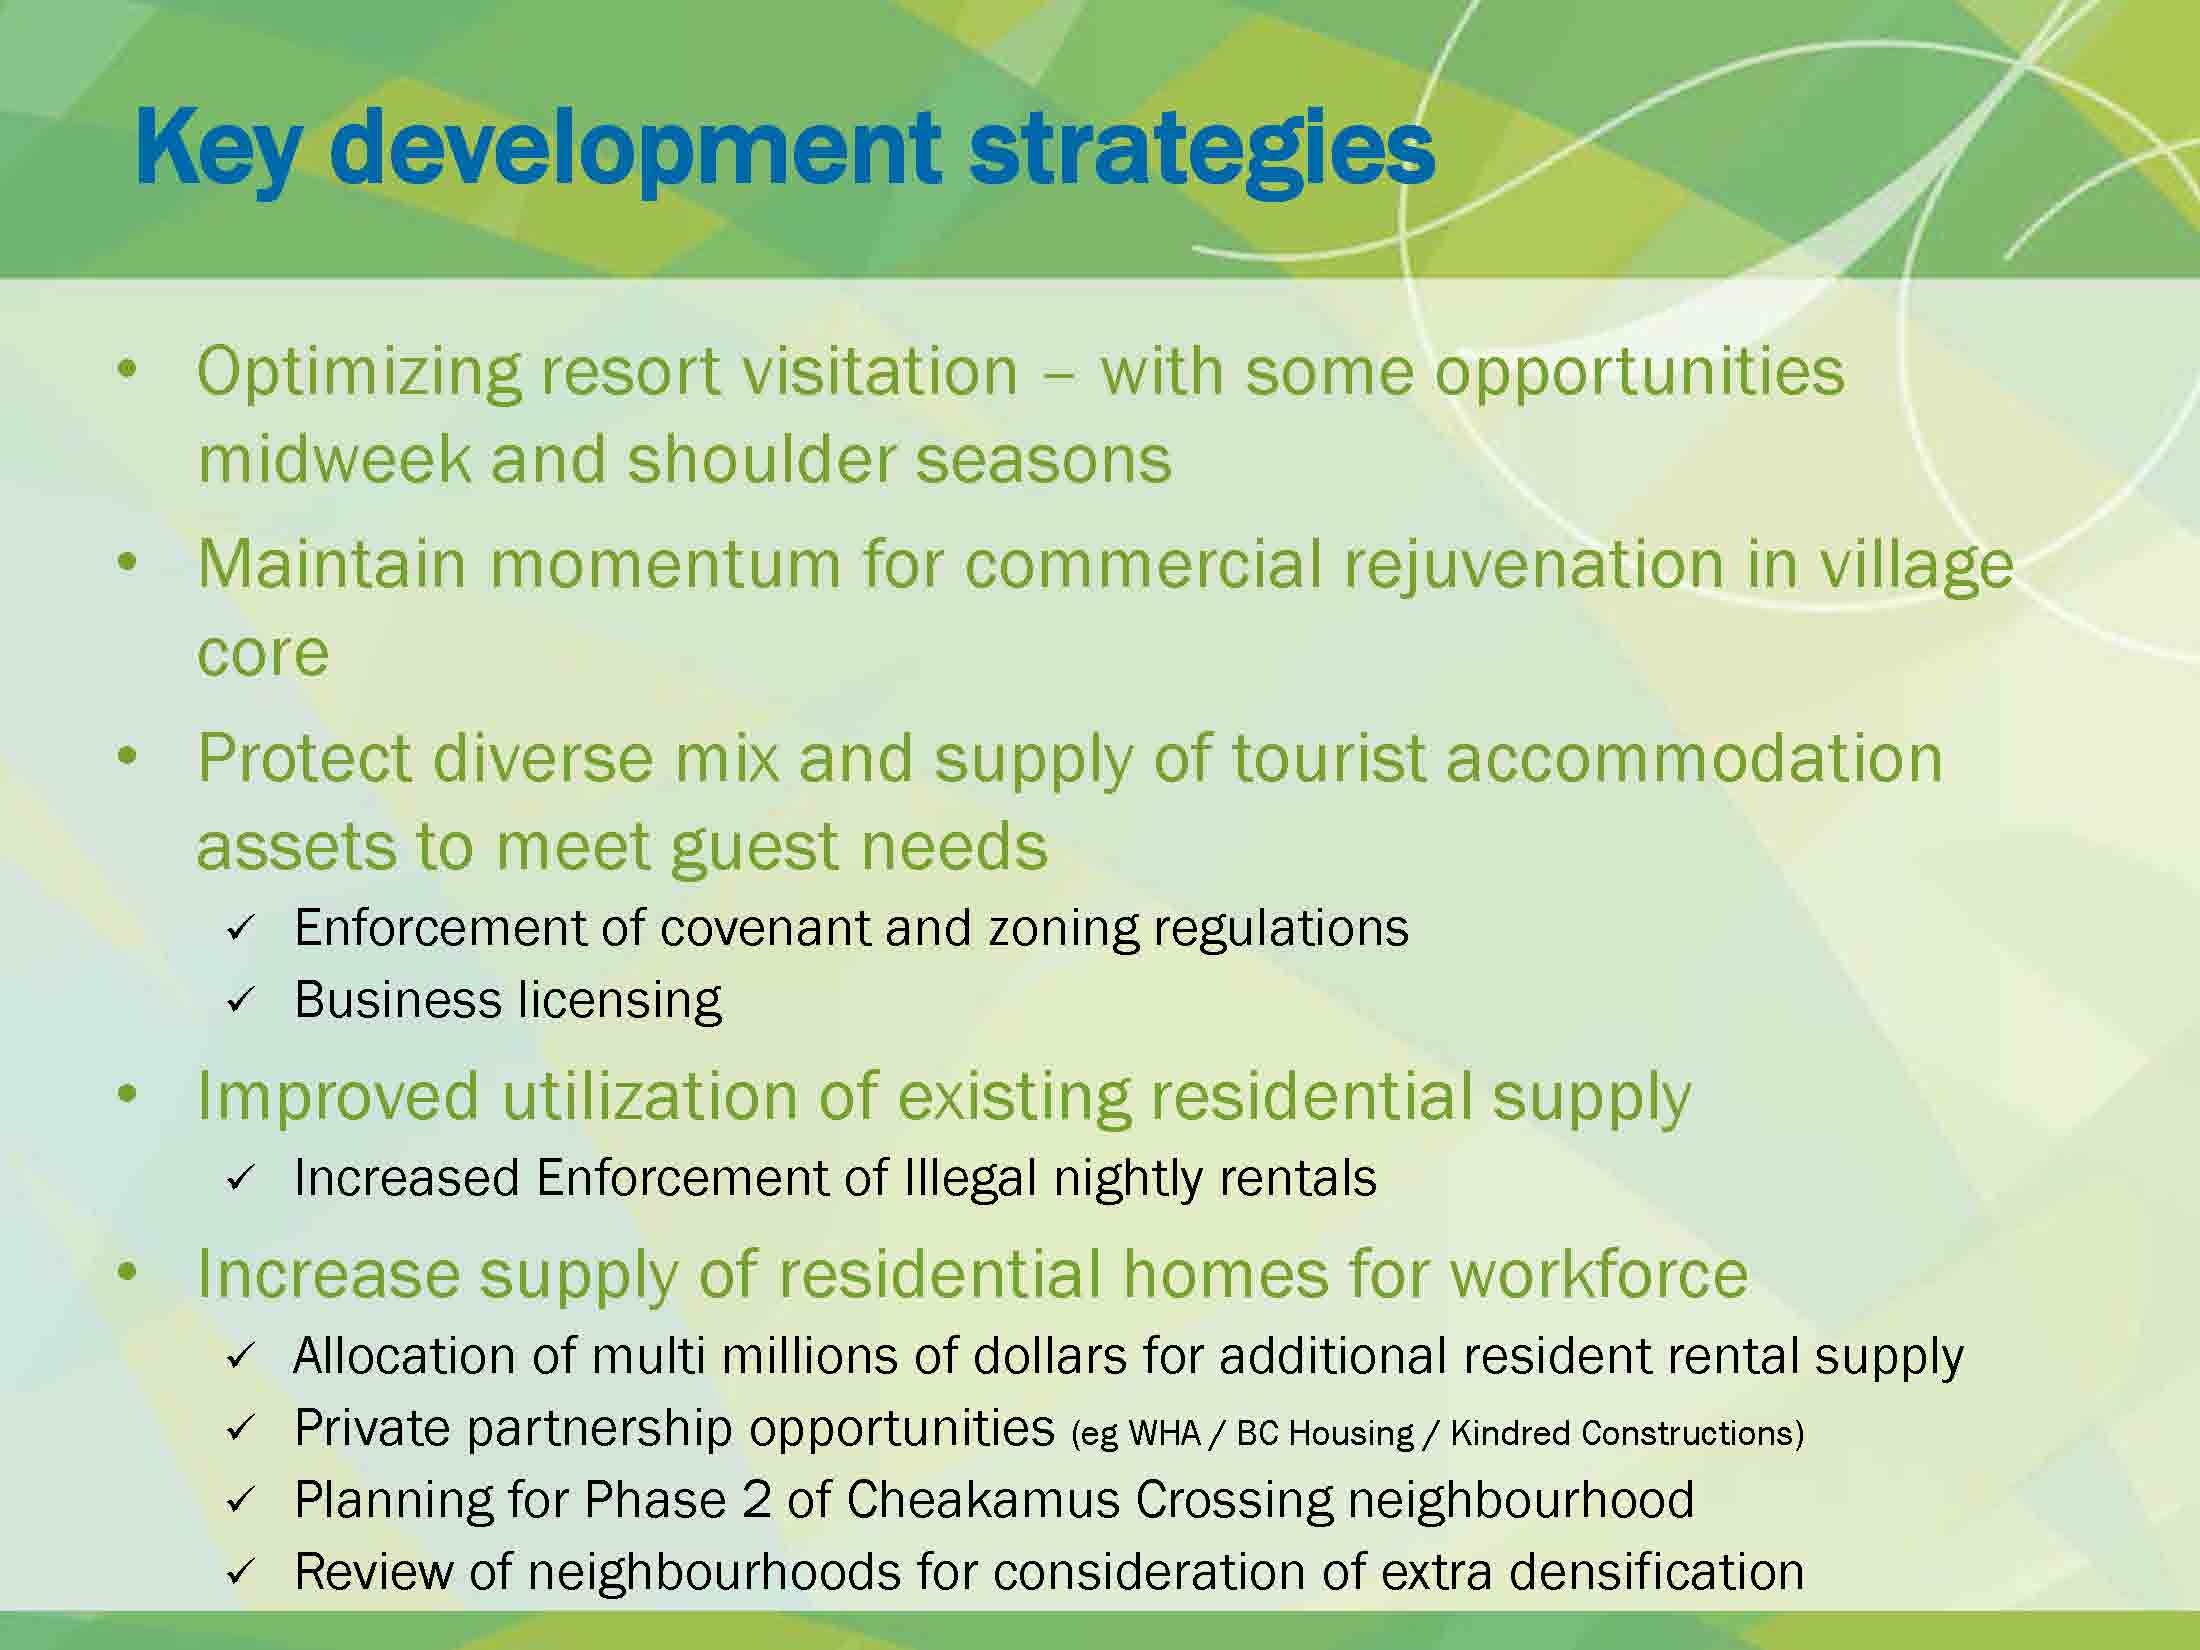
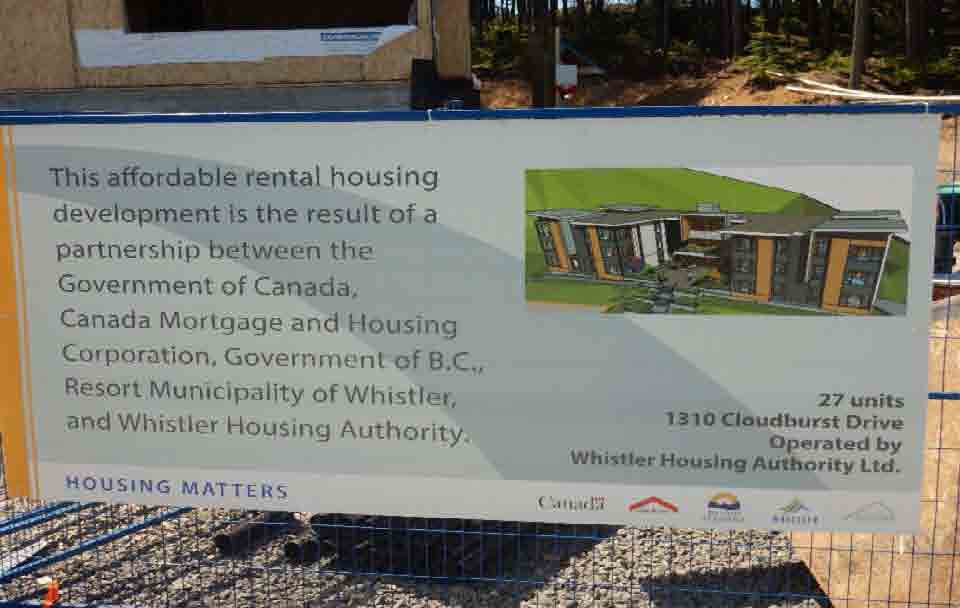
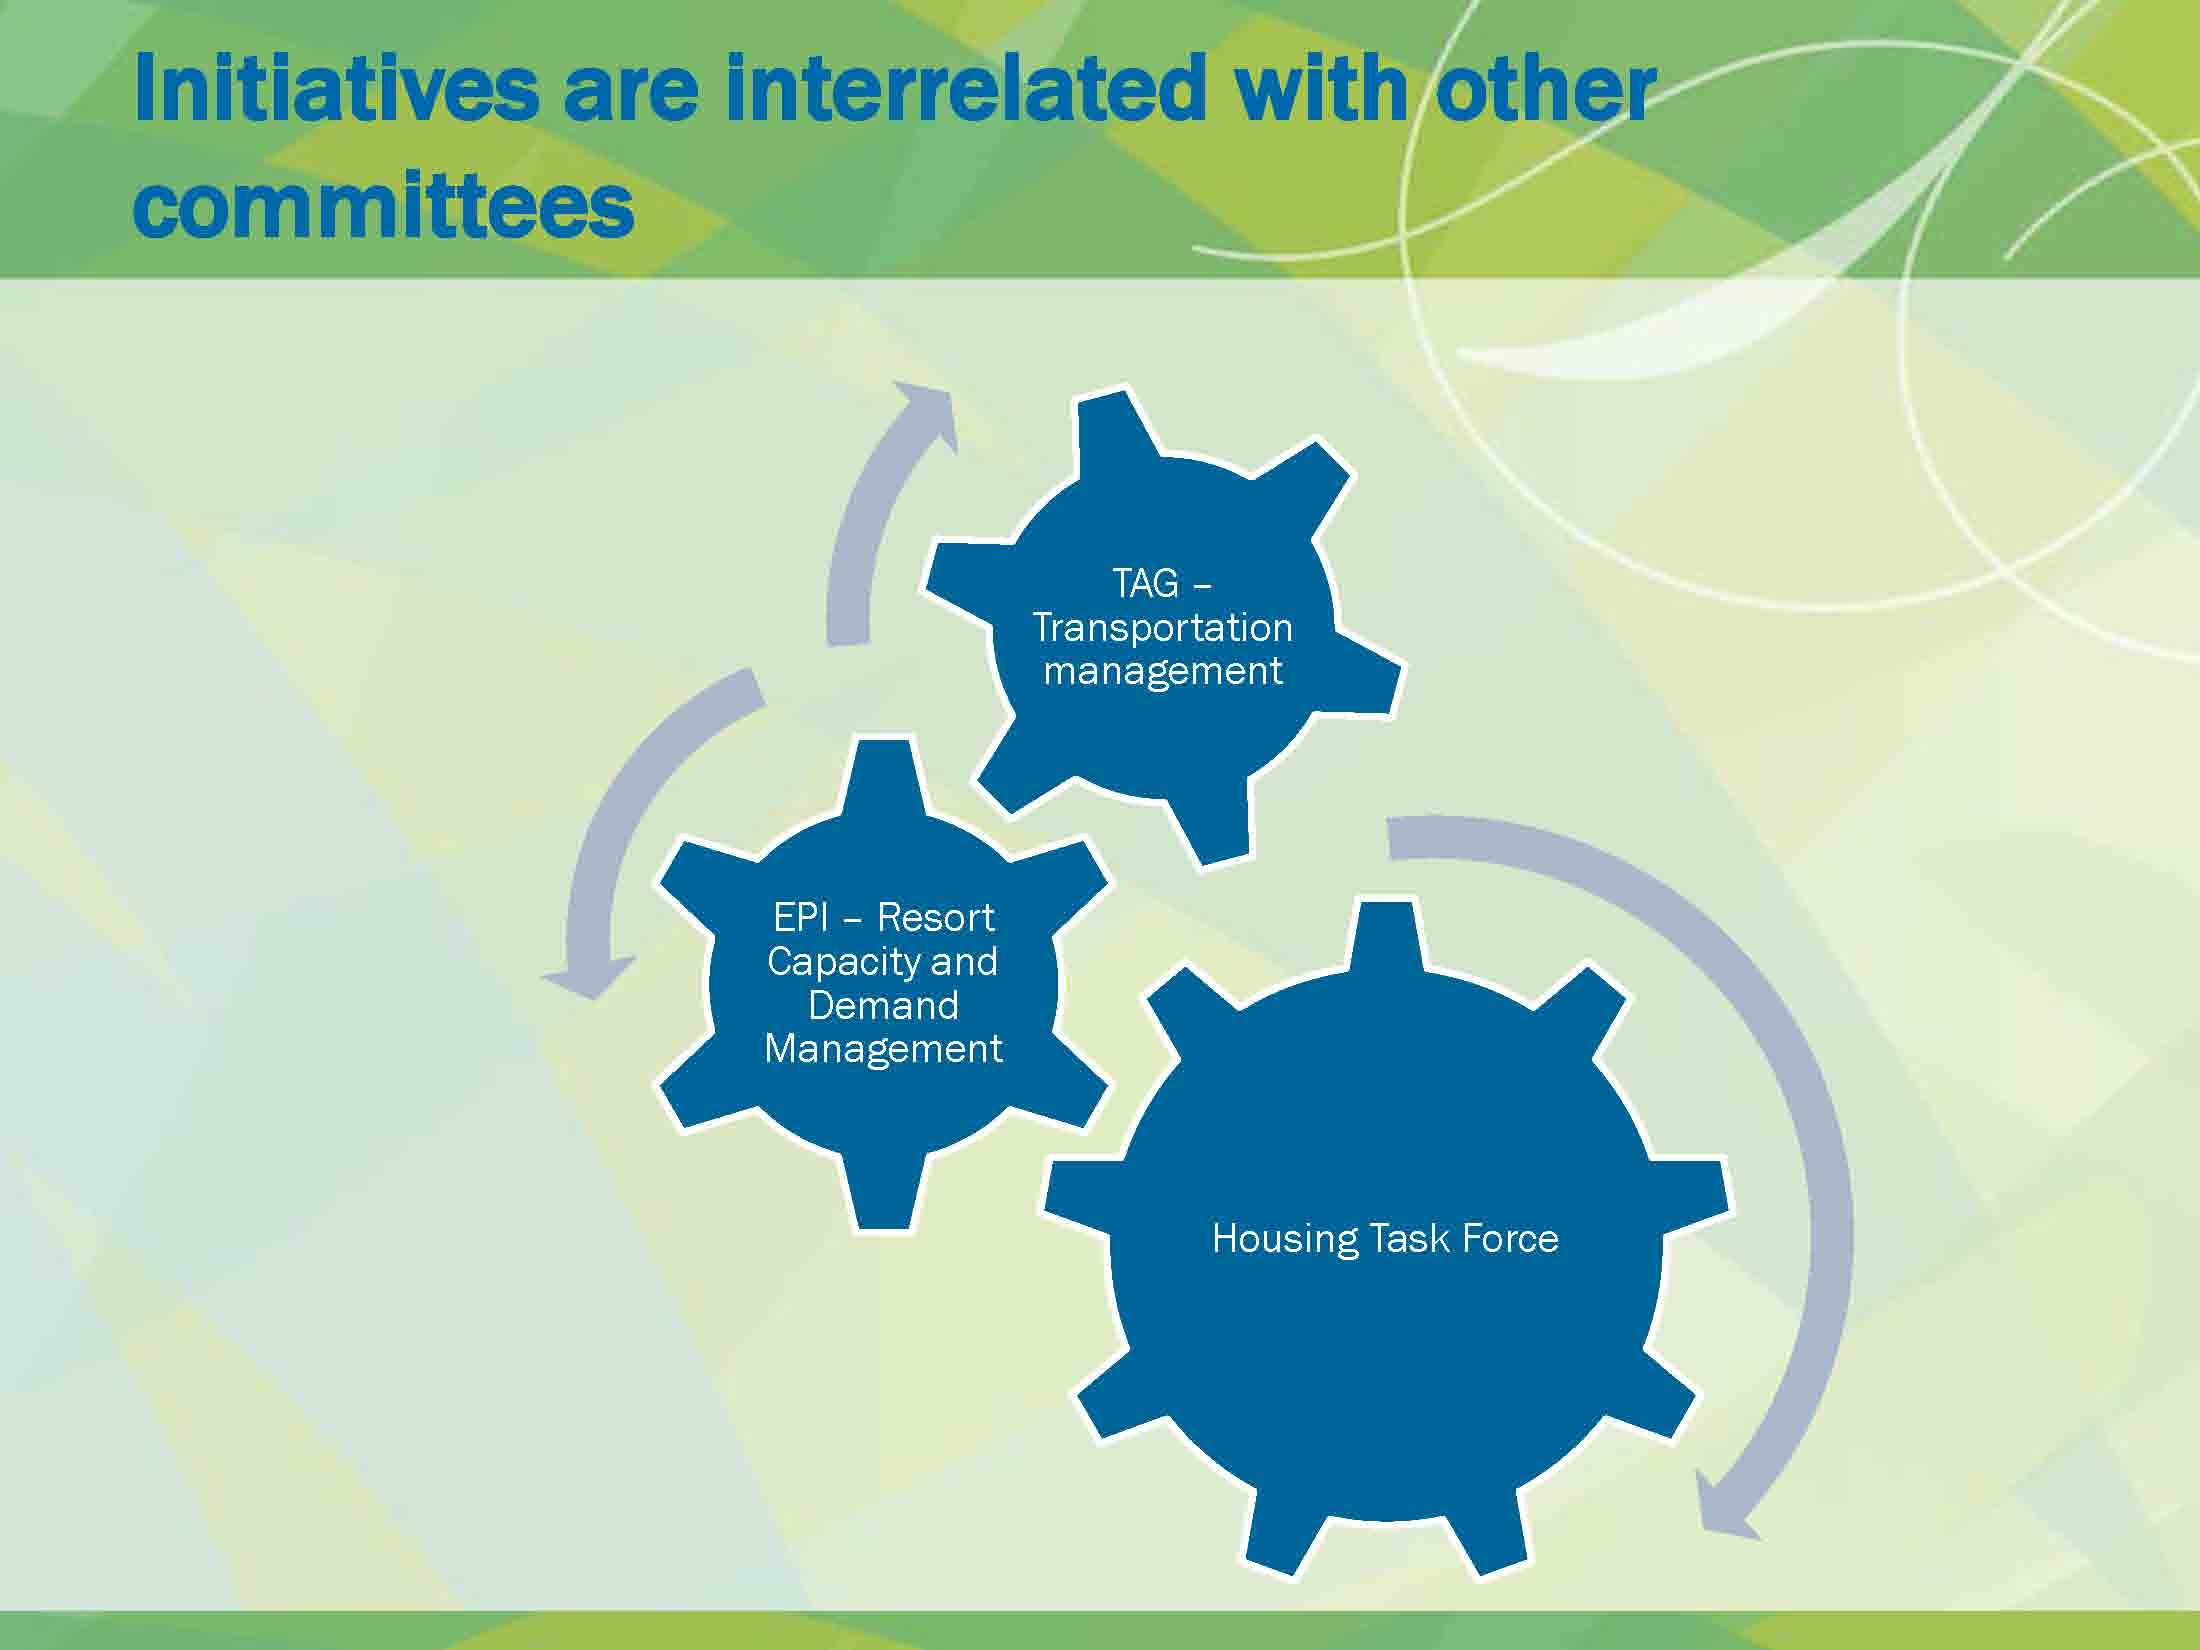
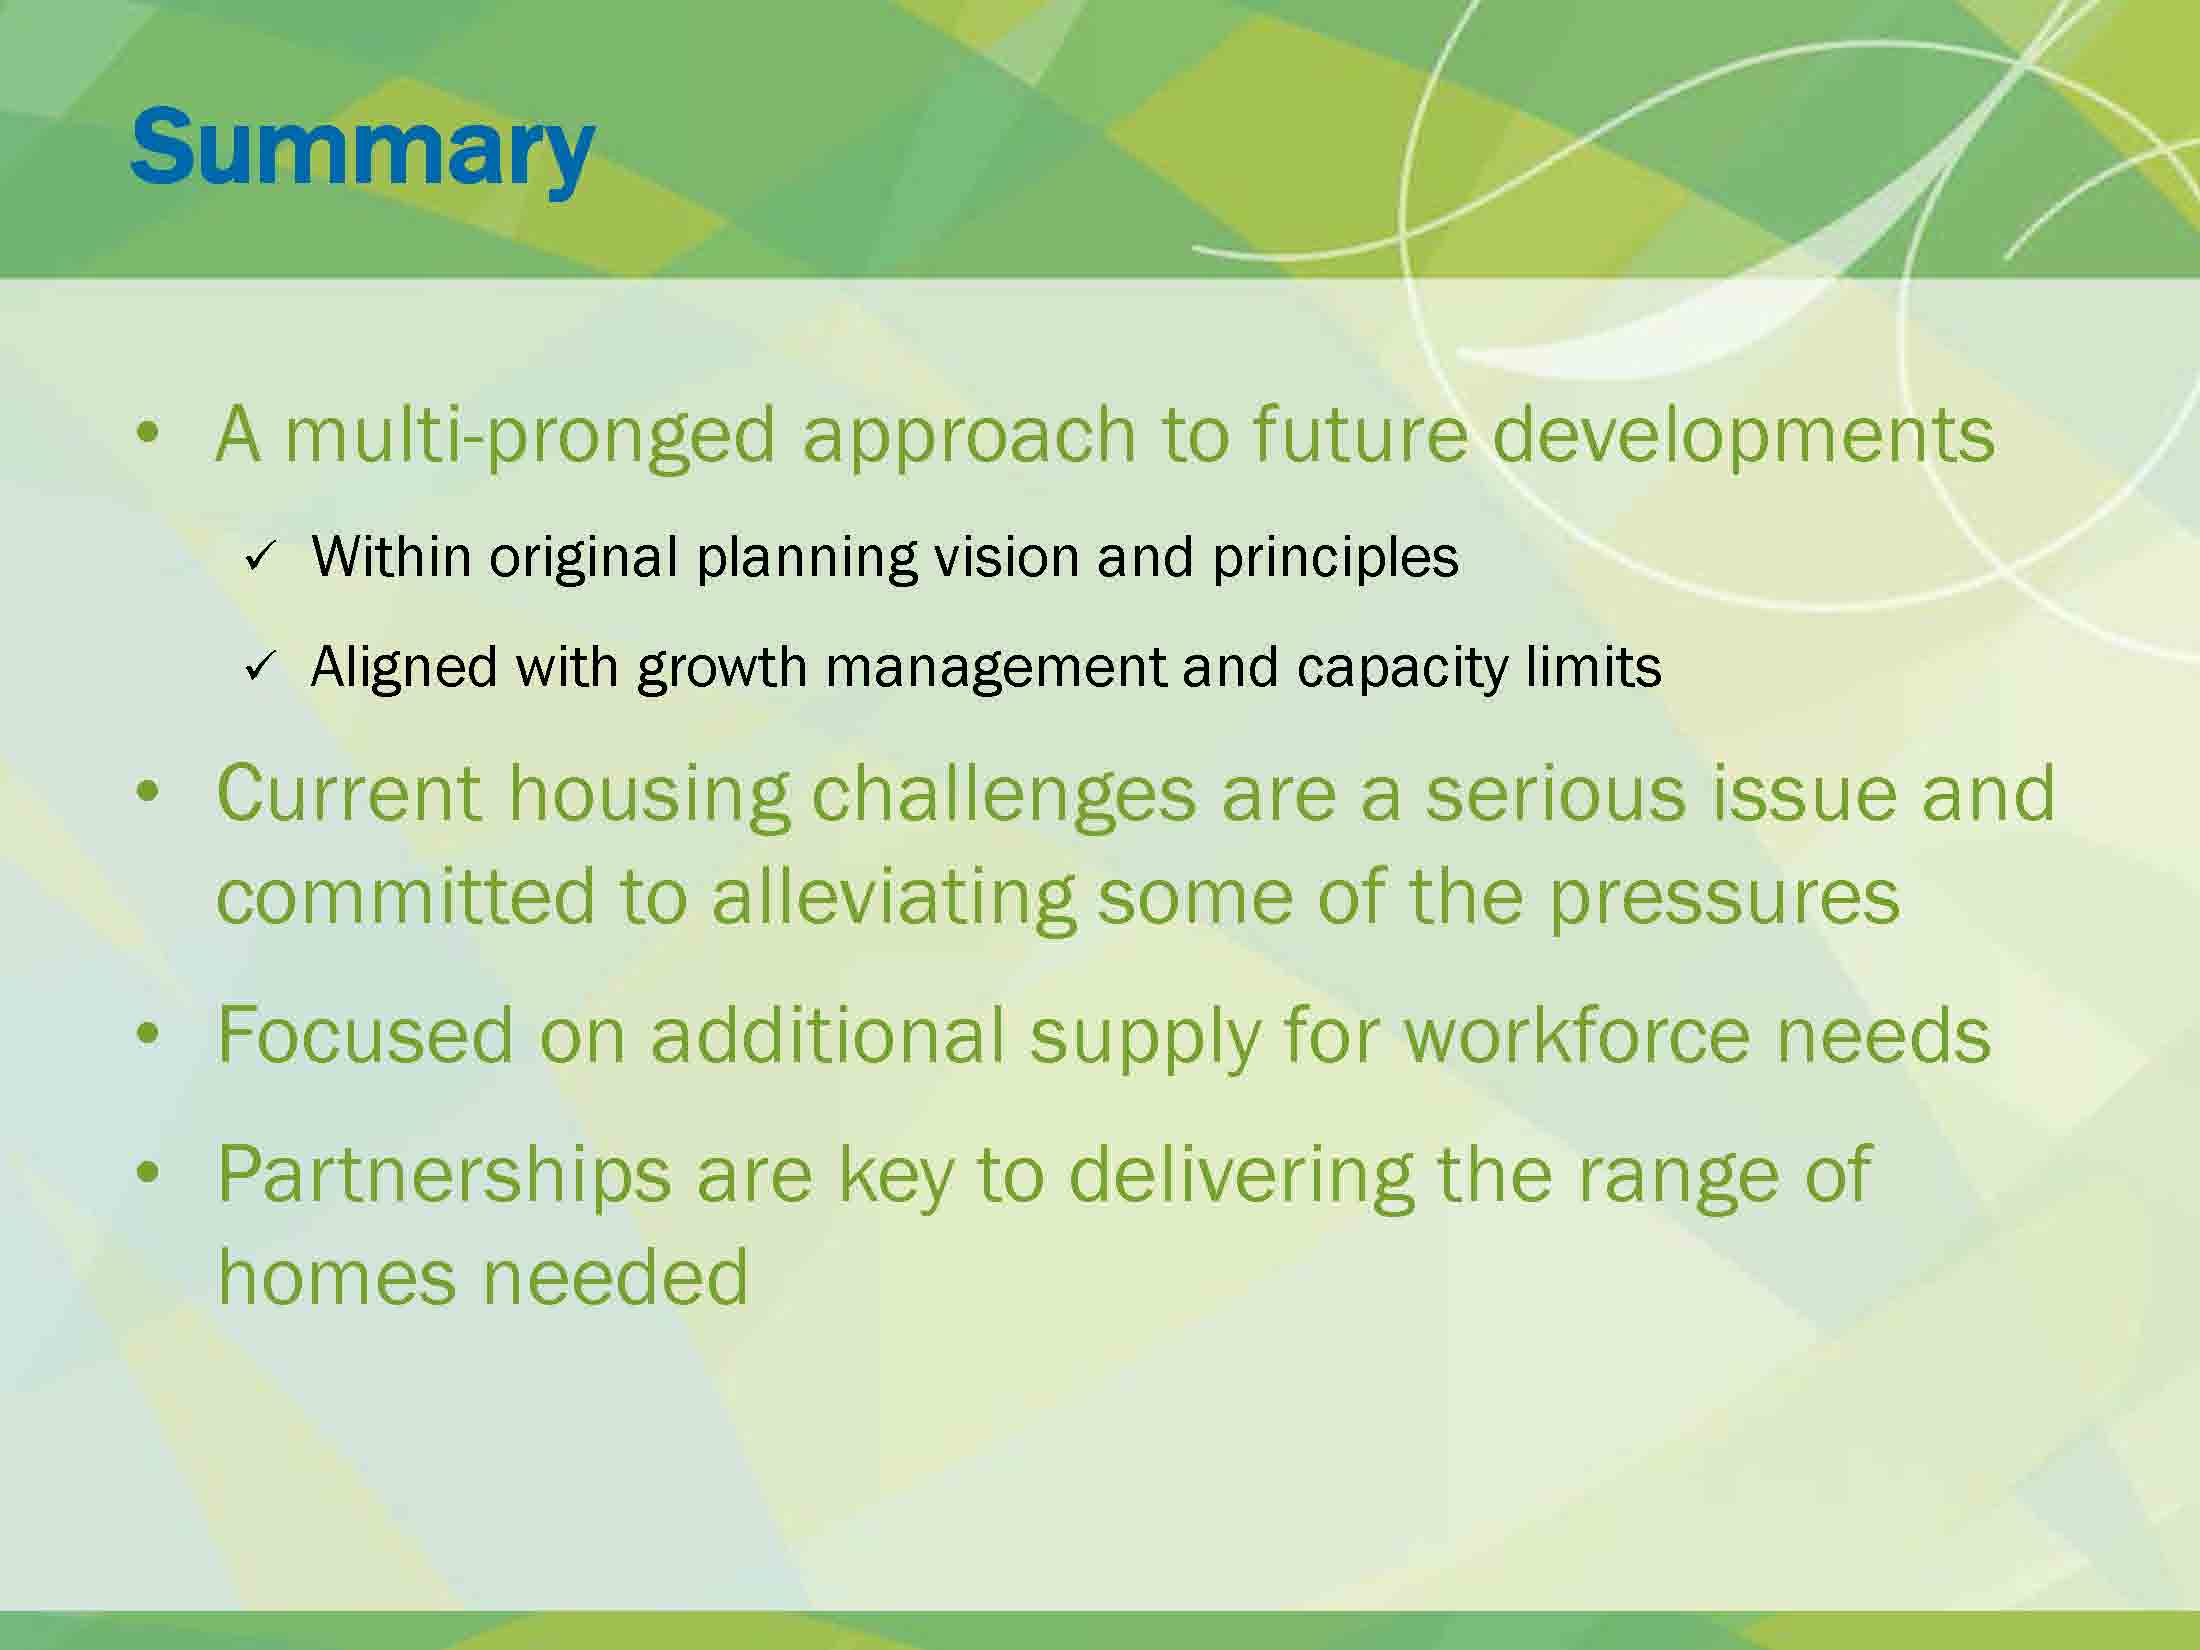
Whistler Market Update
Click on the picture to follow the link to our blog. This is a full presentation on the current situation and future plans for the Whistler economy and the real estate market.

Real Estate Headlines
BC Real Estate Prices Keep Climbing On Low Supply
Sales may be down from last year’s record-breaking activity, but that doesn’t mean home prices across the province are falling, according to the latest figures from the British Columbia Real Estate Association (BCREA) released July 13. Read more…
Advice for retirees who must answer the question: Buy, sell or rent?
It wasn’t that long ago when the outlook for retirees focused on baby boomers downsizing and moving into smaller homes in the country — trading an urban lifestyle with a relaxing, rural retirement. Fast forward 20 years, and many retirees are opting to stay in their homes for longer: renovating, upgrading and improving accessibility along the way. Read more…
Whistler, Victoria crack down on short-term rentals like Airbnb
Whistler fines are $1,000 per-day for those renting without a license – and many can’t qualify for a license. Read more…

To keep you up to date with the Real Estate Listings in Whistler, here are links to all properties listed and sold in the last 7 days.
If you are interested in any of the properties or have any other questions, always feel free to contact us!
To keep you up to date with the Real Estate Listings in Whistler, here are links to all properties listed and sold in the last 7 days.
If you are interested in any of the properties or have any other questions, always feel free to contact us!
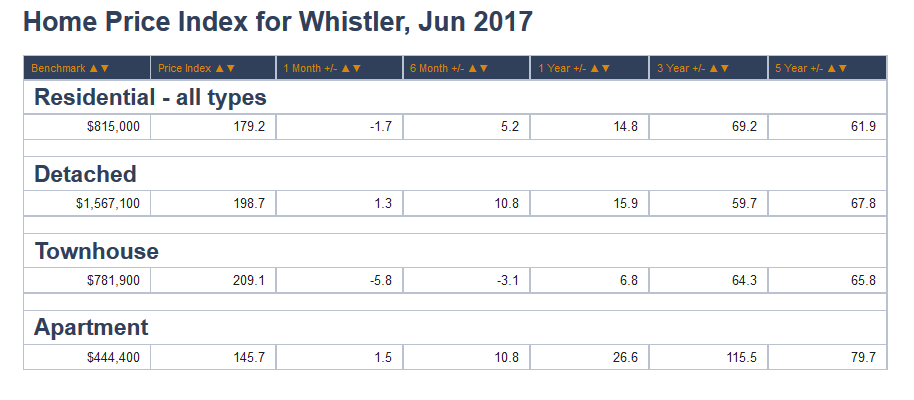
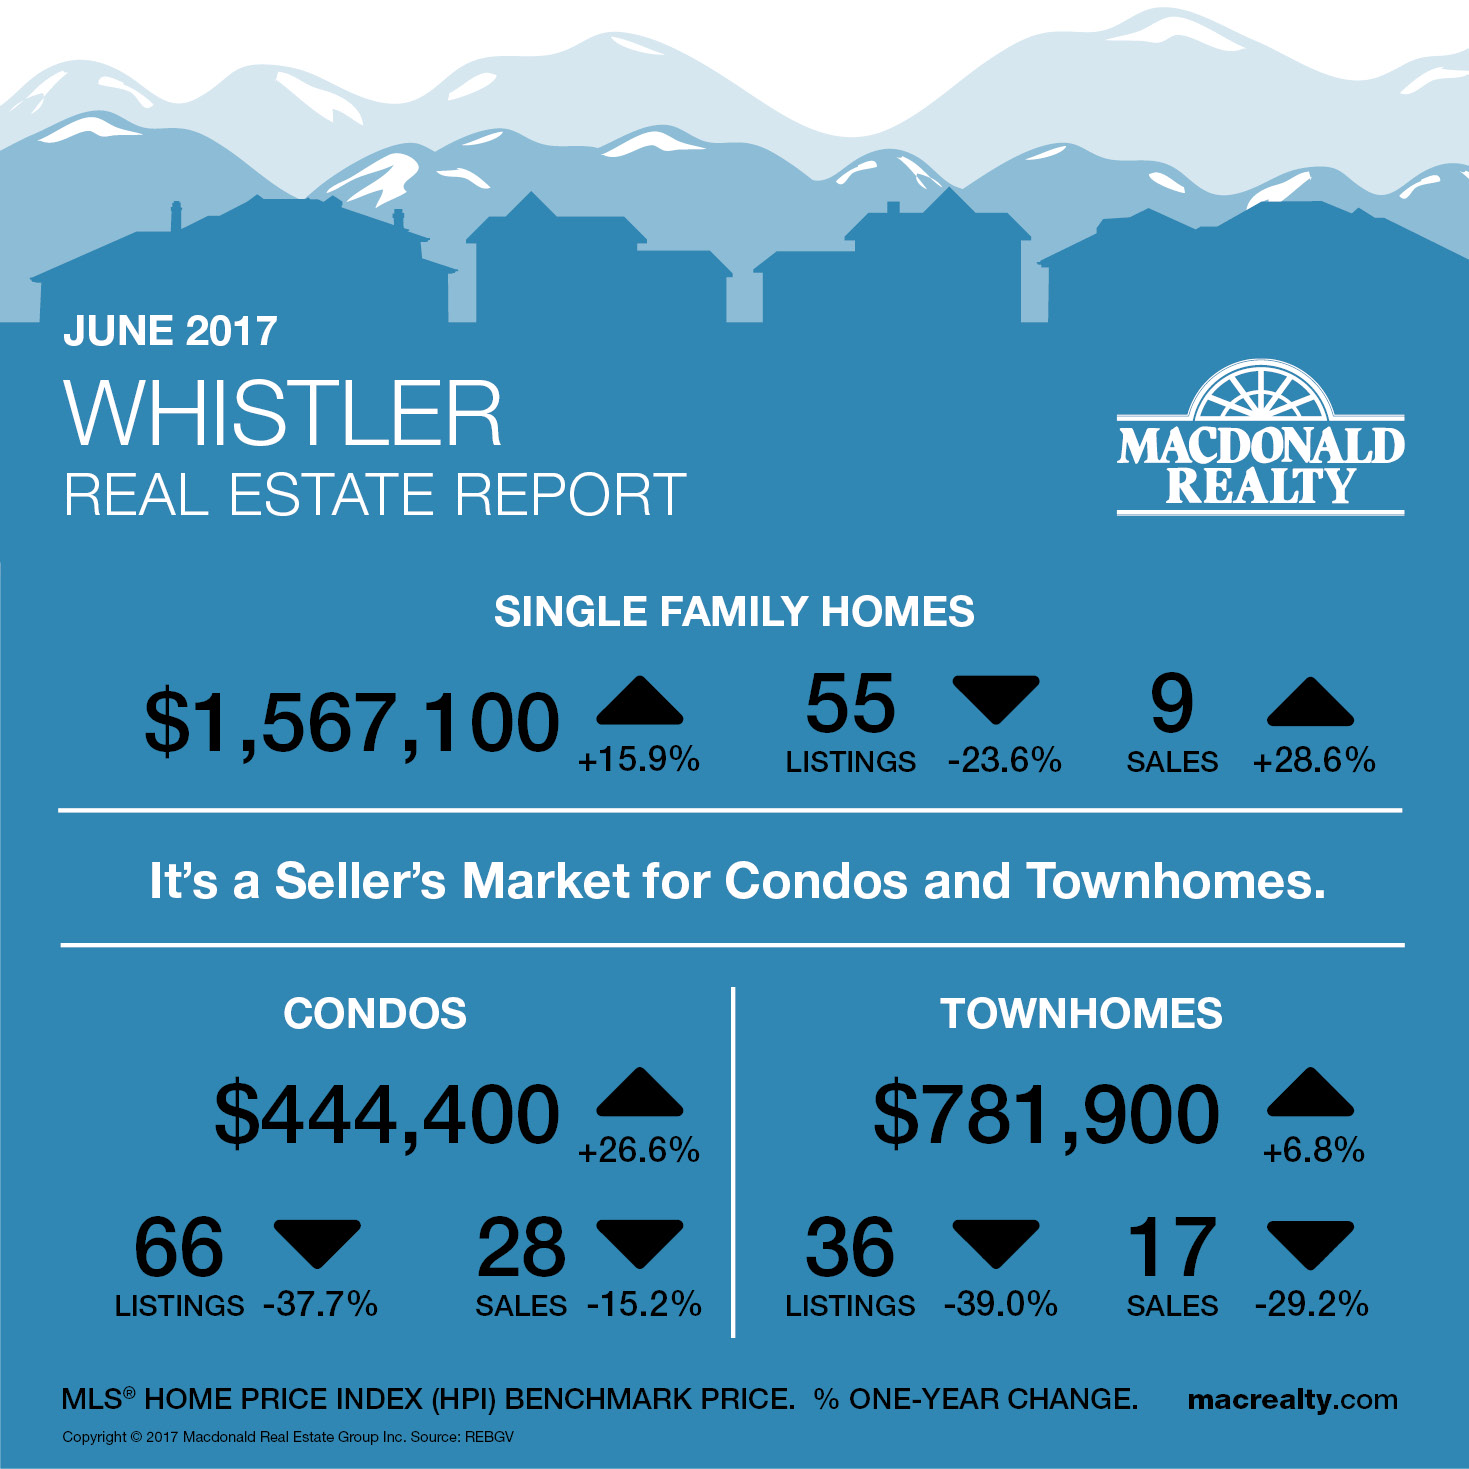
In the Whistler market, the benchmark sale price was $1,567,100 with an average days on market of 59 days for detached homes. At the end of the month, there were 9 sales and 55 active listings on the REBGV MLS® (excludes Whistler Listing System numbers).
In comparison, the condo market had 28 sales and 66 active listings. The benchmark sale price was $444,400, and the average days on market were 55.
Townhome featured 17 sales, 36 active listings and a $781,900 benchmark sale price with 21 days on market average
It’s a seller’s market for condos and townhomes.
To keep you up to date with the Real Estate Listings in Whistler, here are links to all properties listed and sold in the last 7 days.
If you are interested in any of the properties or have any other questions, always feel free to contact us!
To keep you up to date with the Real Estate Listings in Whistler, here are links to all properties listed and sold in the last 7 days.
If you are interested in any of the properties or have any other questions, always feel free to contact us!
New listings in the last 7 days
Sold listings in the last 7 days
Price Changes in the last 7 days
To keep you up to date with the Real Estate Listings in Whistler, here are links to all properties listed and sold in the last 7 days.
If you are interested in any of the properties or have any other questions, always feel free to contact us!
New listings in the last 7 days
Sold listings in the last 7 days

Greetings from Whistler on Family Day where we are celebrating with sunshine and perfect snow conditions after the huge snowfall last week.
See you soon and let us know how we can assist with your real estate needs. We are hard at work.
Our challenge in our market is the lack of selection; so let’s get working together to find your next Whistler investment or if you are thinking
about selling take advantage of record high prices for Sellers.
Here is a link to view all chalets on the market
Here is a link to view all townhomes on the market
Here is a link to view all the Phase One condos for sale
Here is a link to view all the Phase Two condo hotels for sale
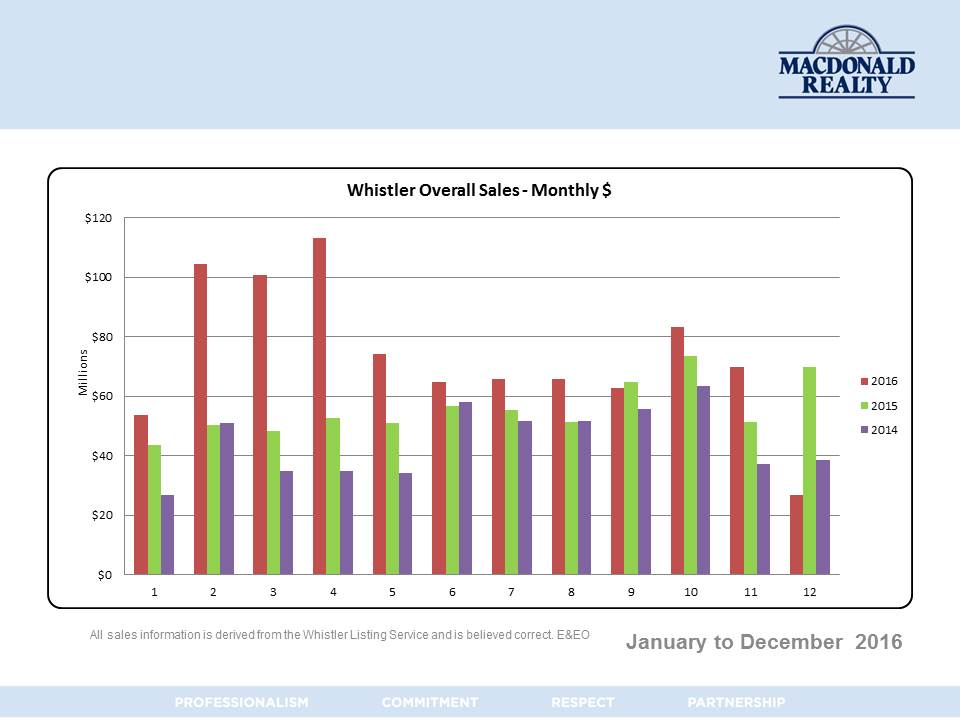
Whistler 2016 Real Estate Statistics
2016 was certainly an interesting year in Whistler Real Estate, we saw prices soar and inventory drop to some of the lowest numbers in recent years.
See the full statistics on our Blog, click here.
Market Report 2016-17:
Macdonald Realty Annual Review and Forecast
It would be an understatement to say 2016 was a memorable year for BC real estate. The recent spate of policy changes, along with a looming provincial election, have given buyers and sellers much information to absorb as we enter the 2017 spring market. The Feature Story of our 2016-17 Market Report, “The BC real estate market in 2016: a year with many chapters“, offers an industry insiders look at these important changes.
The Market Report contains a 2016 review and 2017 forecast for each of our geographic markets across B.C., contributed by our local managers, as well as summaries from our residential, commercial, property management, project marketing and global relocation divisions.
Read or download the full report on our Blog, click here.
It would be an understatement to say 2016 was a memorable year for BC real estate. The recent spate of policy changes, along with a looming provincial election, have given buyers and sellers much information to absorb as we enter the 2017 spring market. The Feature Story of our 2016-17 Market Report, “The BC real estate market in 2016: a year with many chapters“, offers an industry insiders look at these important changes.
The Market Report contains a 2016 review and 2017 forecast for each of our geographic markets across B.C., contributed by our local managers, as well as summaries from our residential, commercial, property management, project marketing and global relocation divisions.
Click to view:
PDF Market Report (English) | (Chinese)
Digital Brochure Market Report (English)
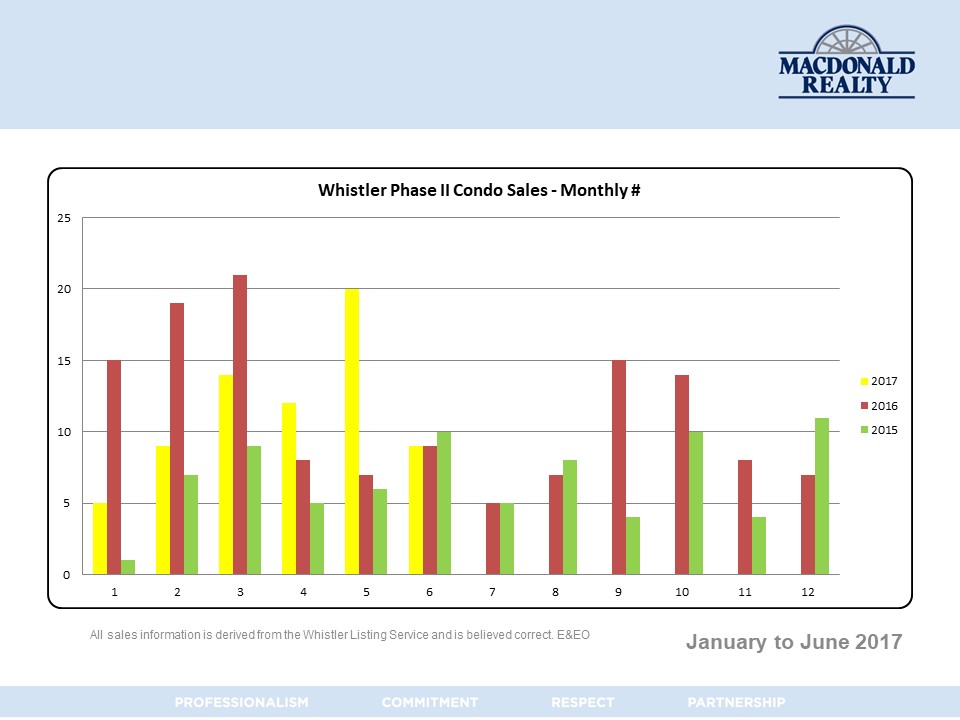
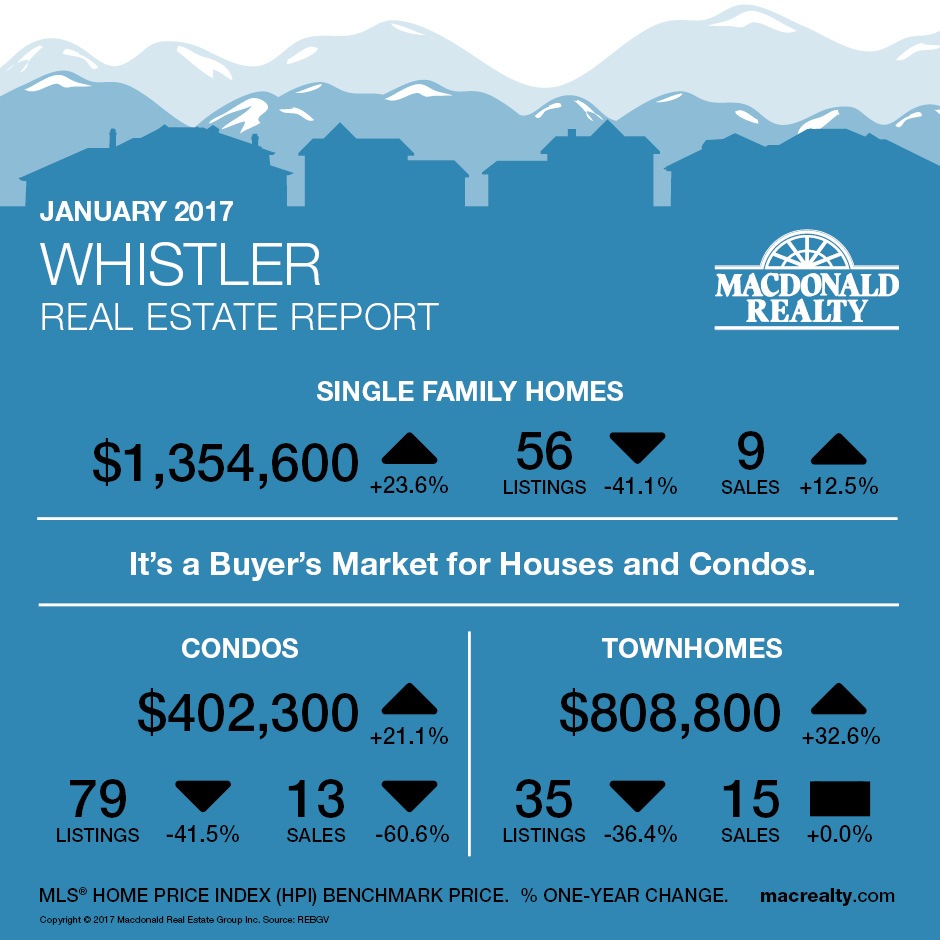
In the Whistler market, the benchmark sale price was $1,354,600 with an average days on market of 109 days for detached homes. At the end of January, there were 9 sales and 56 active listings on the REBGV MLS® (excludes Whistler Listing System numbers).
In comparison, the condo market had 13 sales and 79 active listings. The benchmark sale price was $402,300, and the average days on market were 62.
Townhome featured 15 sales, 35 active listings and a $808,800 benchmark sale price with 32 days on market average
It’s a buyer’s market for houses and condos.
To keep you up to date with the Real Estate Listings in Whistler, here are links to all properties listed and sold in the last 7 days.
If you are interested in any of the properties or have any other questions, always feel free to contact us!
New listings in the last 7 days
Sold listings in the last 7 days
The Metro Vancouver* housing market had its third highest selling year on record in 2016, behind only 2015 and 2005.
Sales of detached, attached and apartment properties in the region reached 39,943 in 2016, a 5.6 per cent decrease from the 42,326 sales recorded in 2015, and a 20.6 per cent increase over the 33,116 residential sales in 2014.
“It was an eventful year for real estate in Metro Vancouver. Escalating prices caused by low supply and strong home buyer demand brought more attention to the market than ever before,” Dan Morrison, Real Estate Board of Greater Vancouver (REBGV) president said.
“As prices rose in the first half of the year, public debate waged about what was fuelling demand and what should be done to stop it. This led to multiple government interventions into the market. The long-term effects of these actions won’t be fully understood for some time.”
Residential properties listed for sale on the Multiple Listing Service® (MLS®) in Metro Vancouver reached 57,596 in 2016. This is an increase of 0.6 per cent compared to the 57,249 properties listed in 2015 and a 2.6 per cent increase compared to the 56,066 properties listed in 2014.
“The supply of homes for sale couldn’t keep up with home buyer demand for much of 2016. This allowed home sellers to raise their asking price. It wasn’t until the last half of the year that prices began to show modest declines.”
The MLS® Home Price Index (HPI) composite benchmark price for all residential properties in Metro Vancouver ends the year at $897,600. This represents a 2.2 per cent decrease over the past six months and a 17.8 per cent increase compared to December 2015.
December summary
Residential property sales in the region totalled 1,714 in December 2016, a decrease of 39.4 per cent from the 2,827 sales recorded in December 2015 and a decrease of 22.6 per cent compared to November 2016 when 2,214 homes sold.
Last month’s sales were 8.1 per cent below the 10-year sales average for the month.
New listings for detached, attached and apartment properties in Metro Vancouver totalled 1,312 in December 2016. This represents a decrease of 35.1 per cent compared to the 2,021 units listed in December 2015 and a 58.3 per cent decrease compared to November 2016 when 3,147 properties were listed.
The total number of properties currently listed for sale on the MLS® in Metro Vancouver is 6,345, a 5.3 per cent increase compared to December 2015 (6,024) and a 24.3 per cent decrease compared to November 2016 (8,385).
Sales of detached properties in December 2016 reached 541, a decrease of 52.4 per cent from the 1,136 detached sales recorded in December 2015. The benchmark price for detached properties is $1,483,500. This represents an 18.6 per cent increase compared to December 2015 and a 1.8 per cent decrease compared to November 2016.
Sales of apartment properties reached 915 in December 2016, a decrease of 25.3 per cent compared to the 1,225 sales in December 2015.The benchmark price of an apartment property is $510,300. This represents a 17.3 per cent increase compared to December 2015 and a 0.3 per cent decrease compared to November 2016.
Attached property sales in December 2016 totalled 258, a decrease of 44.6 per cent compared to the 466 sales in December 2015. The benchmark price of an attached unit is $661,800. This represents a 20.4 per cent increase compared to December 2015 and a 0.8 per cent decrease compared to November 2016.
Download the December 2016 stats package by clicking here
2016 was certainly an interesting year in Whistler Real Estate, we saw prices soar and inventory drop to some of the lowest numbers in recent years.
Here are the 2016 year end statistics for you:

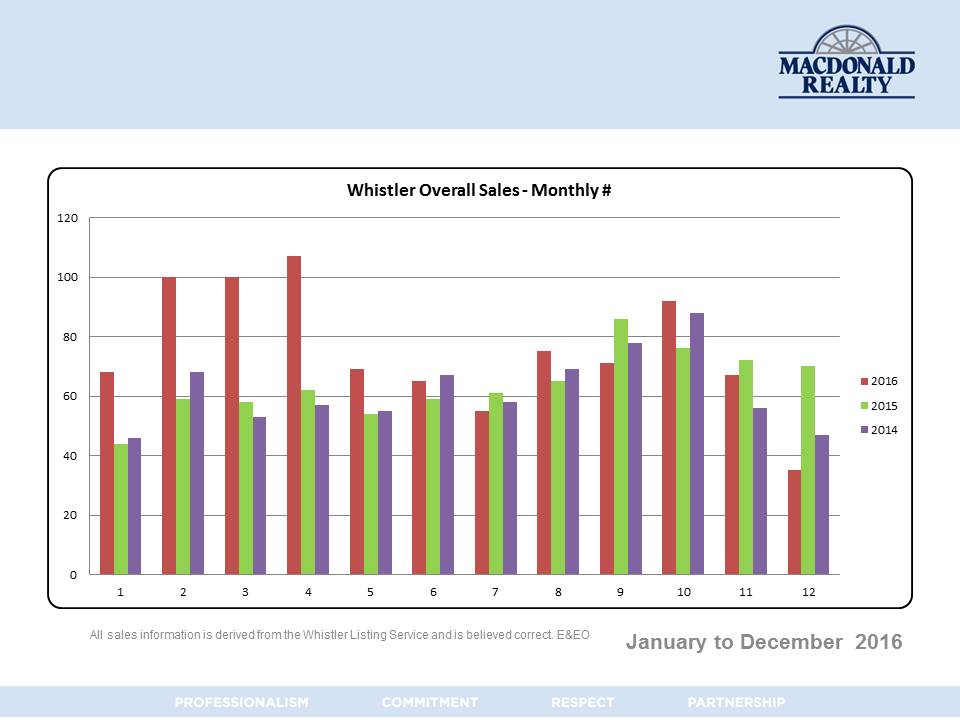
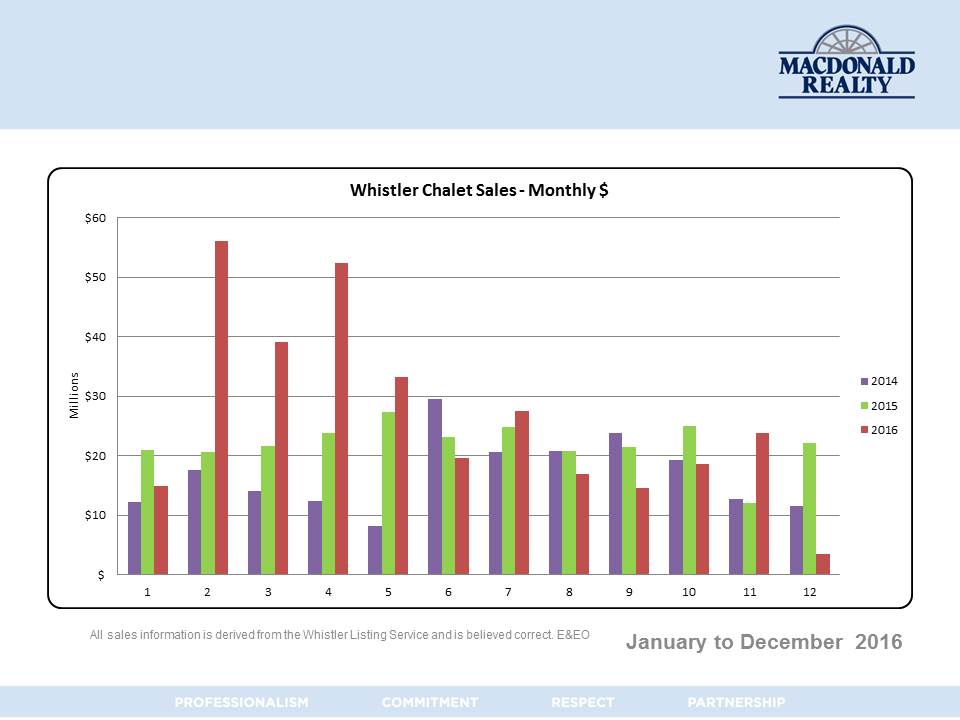
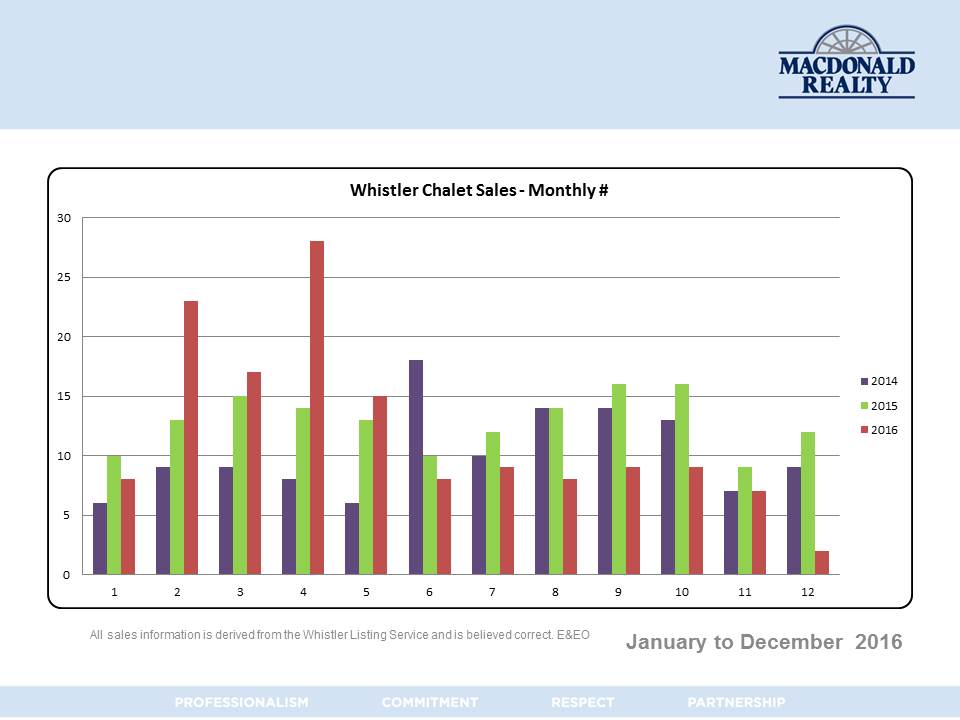
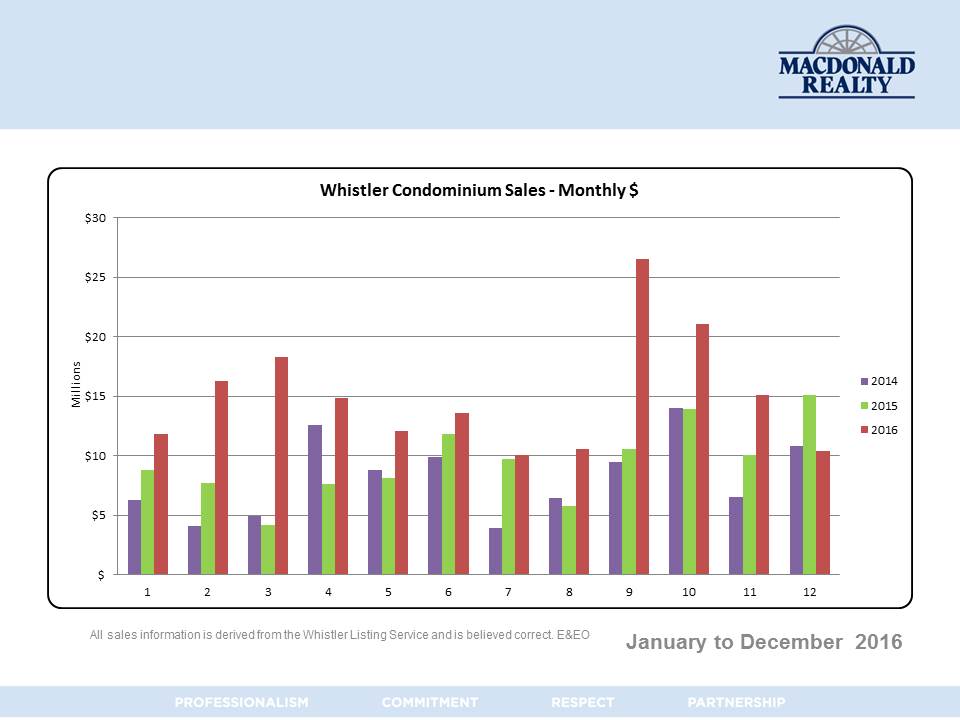
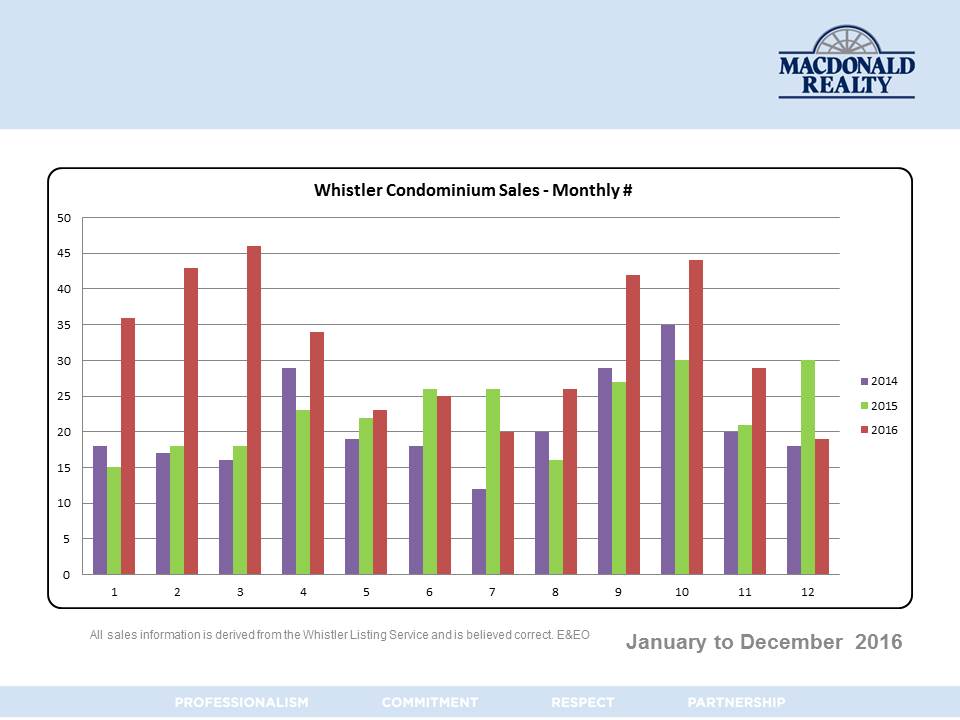
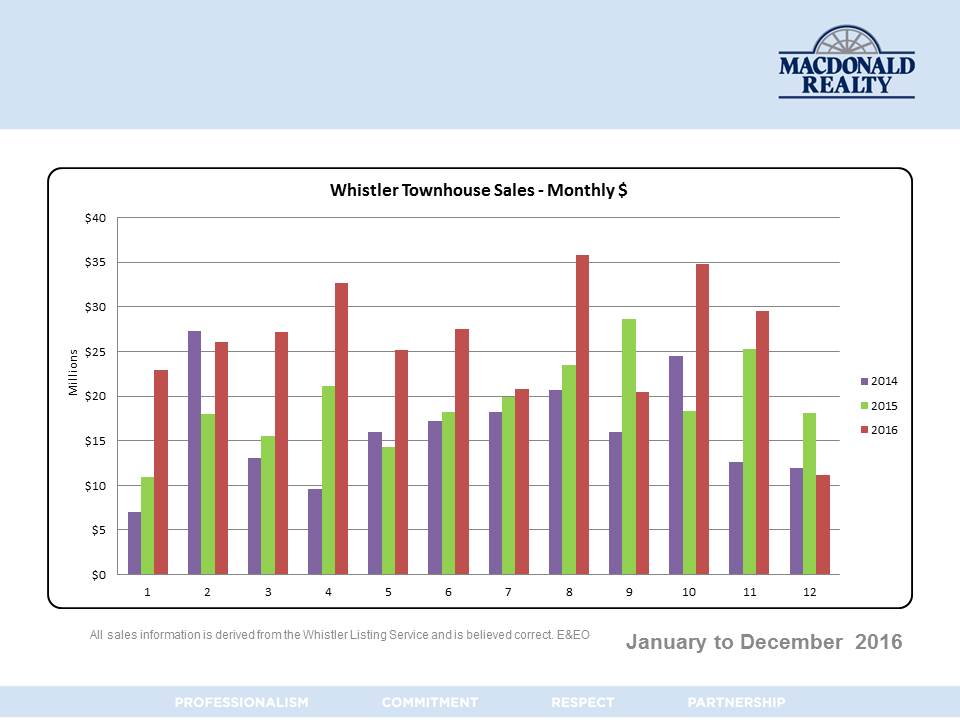

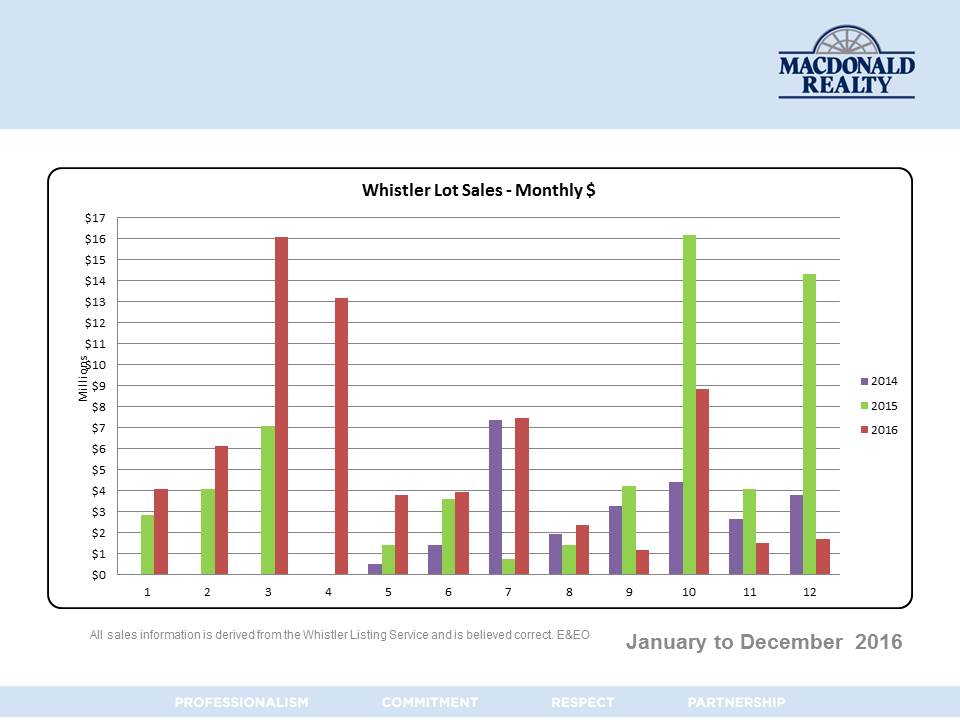
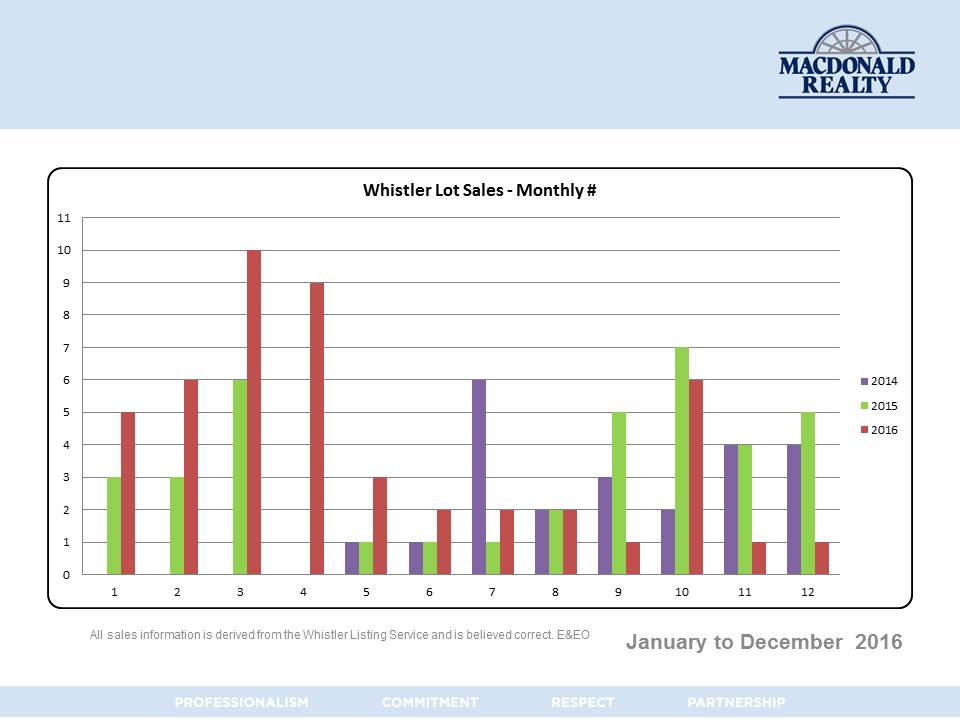


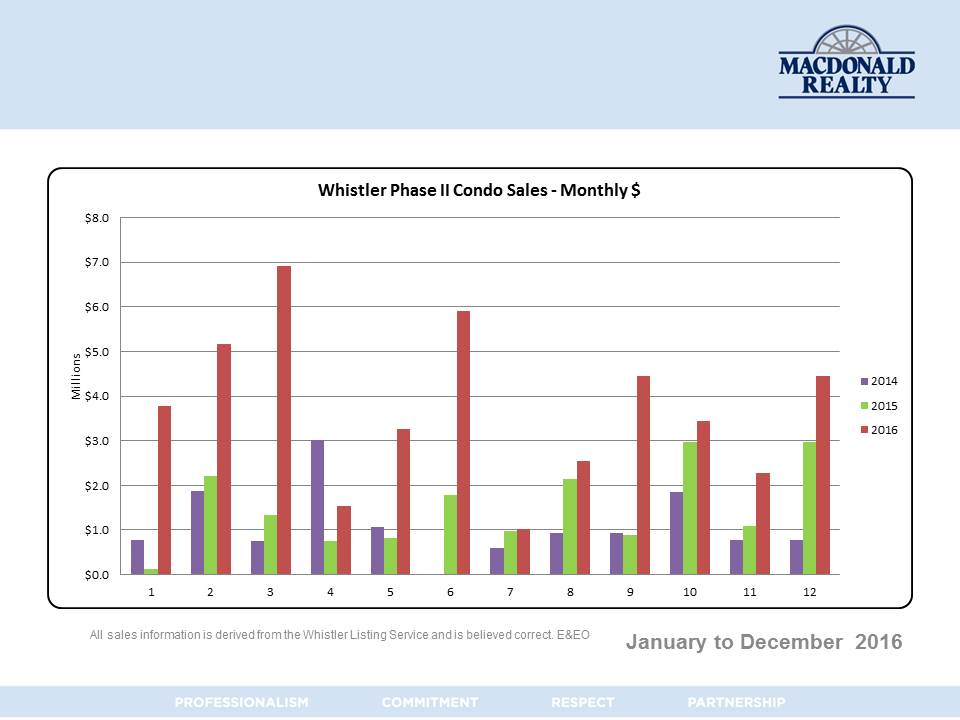
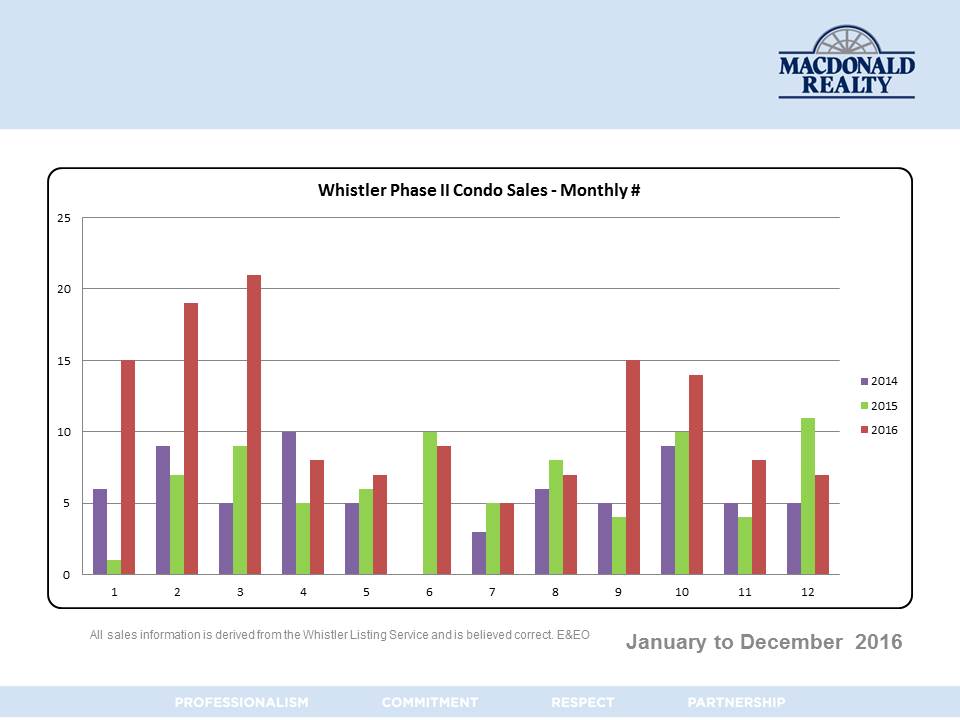
To download a a .pdf version of this presentation please click here.
To keep you up to date with the Real Estate Listings in Whistler, here are links to all properties listed and sold in the last 7 days.
If you are interested in any of the properties or have any other questions, always feel free to contact us!
New listings in the last 7 days
Sold listings in the last 7 days
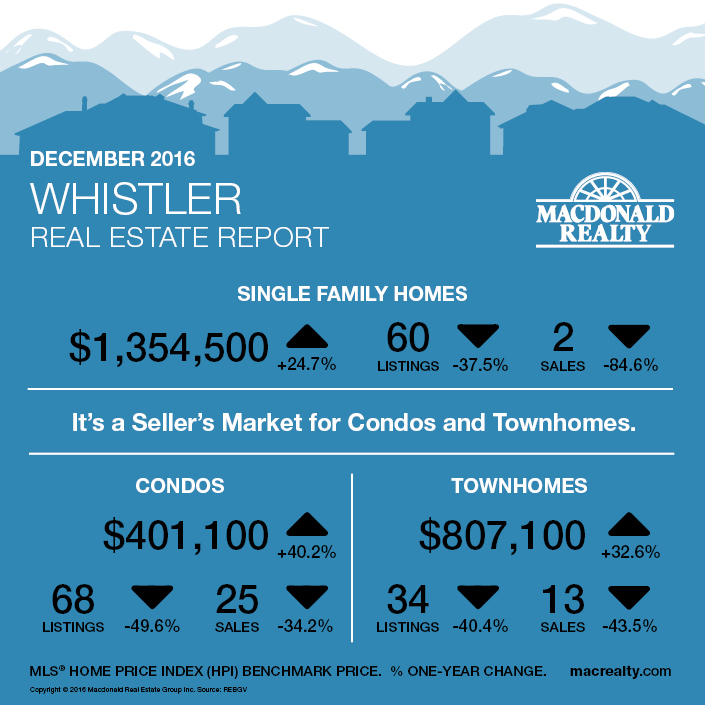
In the Whistler market, the benchmark sale price was $1,354,500 with an average days on market of 72 days for detached homes. At the end of December, there were 2 sales and 60 active listings on the REBGV MLS® (excludes Whistler Listing System numbers).
In comparison, the condo market had 25 sales and 68 active listings. The benchmark sale price was $401,100, and the average days on market were 52.
Townhome featured 13 sales, 34 active listings and a $807,100 benchmark sale price with 70 days on market average
It’s a seller’s market for condos and townhomes.
To keep you up to date with the Real Estate Listings in Whistler, here are links to all properties listed and sold in the last 7 days.
If you are interested in any of the properties or have any other questions, always feel free to contact us!
New listings in the last 7 days
Sold listings in the last 7 days
Originally posted on the Macdonald Realty Blog December 15, 2016 by Jonathan Cooper
A real estate company vice president on his homebuying journey
KEY TAKEAWAYS
Selling my home was, of course, just the first of two chapters.
In part one of this series, I wrote about my experience listing my home and the many ways that our agent helped make the selling process easier and more successful.
When my wife and I woke up the next morning, we found ourselves buyers in the red-hot Vancouver housing market.
We wanted to stay, broadly, in the same Kitsilano area — close to my office, the kids’ grandparents and family-friendly community amenities.
We were searching for a three-bedroom condo, ground-oriented, hopefully with some outdoor space: essentially, the same thing every young family was eyeing in that neighborhood.
Advantage, seller
In the spring 2016 market, every listing that did not have serious defects was selling over asking price, with multiple, subject-free offers.
I work at a real estate company with some 700-plus agents. Our listing agent did a phenomenal job, but as a senior manager at the firm, I needed to share the business around, so we worked with a different buyer’s agent.
After some consideration, I selected someone who I knew to be both hard working and consistently positive. Buying our next home wasn’t going to be easy, and my wife and I wanted to work with an agent who could maintain optimism even if we lost out in a few multiple-offer situations.
A stand-out job early on
We started looking. We spent three weeks going to dozens of open houses.
We came close to writing a few offers, but there were so many other interested parties that we knew the price would push well beyond our budget.
We were starting to get discouraged, and a bit nervous; we only had a few months until we had to move!
Our agent stayed in daily communication with us, and he was always available by cell phone. He didn’t just send us listing auto alerts from the MLS, as many agents in our market do, but personally reviewed all the new inventory as it came out and only sent us the listings that conformed to our core dealbreakers.
’10 out of 10′
After about a month, our agent alerted us to a listing that was only two blocks away from our current home. It was one of a few unsold listings in an already-completed new development.
The photos online were underwhelming, but our agent saw past that. He pointed out that the floor plan might be perfect for us. My wife visited the unit that same afternoon, and sent me a text message: “10 out of 10!”
An hour later, we went for a second look with our Realtor.
Although it was officially listed as a ‘two bedroom,’ it had a large, exterior-facing den. Our agent brought his tape measure, and we mapped out how to convert it into a third bedroom.
And although half the unit faced on to a busy street, because it was built with modern concrete construction, it was very quiet inside. Within three hours of the first viewing, we bought the condo.
Every step of the way
In the weeks before our move, our agent diligently followed up with the developer to ensure the few interior and appliance deficiencies were addressed. He handled all the closing details — the keys, the strata (HOA), the paperwork — so that we could focus on packing up our things.
Every step of the way, our agent added value to the buying process.
He didn’t just wait for us to ask him questions, but was proactive in reaching out to us and making sure we were seeing the right homes. Finding a new home with two small kids in tow is stressful, and our agent was always available.
Even late at night, we could give him a call and talk through options, next steps and strategies.
Just as our listing agent was able to realize a higher sale price for us through his full service approach, our buying agent saved us tens of thousands of dollars by finding a listing that did not on the face of it meet our needs, but worked great when we scratched beneath the surface.
Working with full-time, committed real estate professionals in both selling and buying helped us achieve a successful transition in our lives with a minimum of stress.
In North America, where everyone knows 10-plus agents, the ones who do it right set themselves apart.
Jonathan Cooper is vice president, operations at Macdonald Real Estate Group. You can follow him on Twitter @jtscooper or on LinkedIn.
To keep you up to date with the Real Estate Listings in Whistler, here are links to all properties listed and sold in the last 7 days.
If you are interested in any of the properties or have any other questions, always feel free to contact us!
New listings in the last 7 days
Sold listings in the last 7 days
To keep you up to date with the Real Estate Listings in Whistler, here is are links to all properties listed and sold in the last 7 days.
If you are interested in any of the properties or have any other questions, always feel free to contact us!
New listings in the last 7 days
Sold listings in the last 7 days
Home sales and listings just below 10-year average
Home buyer and seller activity remains near historical averages in the Metro Vancouver housing market.
Residential home sales in the region totalled 2,214 in November 2016, a decrease of 0.9 per cent from the 2,233 sales recorded in October 2016 and a decrease of 37.2 per cent compared to November 2015 when 3,524 homes sold.
Last month’s sales were 7.6 per cent below the 10-year sales average for the month.
“While 2016 has been anything but a normal year for the Metro Vancouver housing market, supply and demand totals have returned to more historically normal levels over the last few months,” said Dan Morrison, Real Estate Board of Greater Vancouver (REBGV) president.
New listings for detached, attached and apartment properties in Metro Vancouver totalled 3,147 in November 2016. This represents a decrease of 20.9 per cent compared to the 3,981 units listed in October 2016 and a 7.2 per cent decrease compared to November 2015 when 3,392 properties were listed.
Last month’s new listing count was 1.2 per cent below the region’s 10-year new listing average for the month.
The total number of properties currently listed for sale on the MLS® system in Metro Vancouver is 8,385, an 8.3 per cent decrease compared to October 2016 (9,143) and a 3.6 per cent increase compared to November 2015 (8,096).
The sales-to-active listings ratio for November 2016 is 26.4 per cent. This is up two per cent from last month (24.4 per cent).
Downward pressure on home prices can occur when the ratio dips below the 12 per cent mark for a sustained period, while home prices can experience upward pressure when it surpasses 20 per cent over several months.
“Demand, relative to supply, for detached homes is lower right now than demand for townhomes and apartments,” Morrison said. “This is causing prices to remain stable, or flat, for townhomes and apartments, while detached homes are seeing modest month-over-month declines.”
The MLS® Home Price Index composite benchmark price for all residential properties in Metro Vancouver is currently $908,300. This represents a 1.2 per cent decrease compared to last month and a 20.5 per cent increase compared to November 2015.
Sales of detached properties in November 2016 reached 638, a decrease of 2.1 per cent from the 652 detached sales recorded in October 2016 and a 52.2 per cent decline over November 2015. The benchmark price for detached properties is $1,511,100. This represents a 2.2 per cent decline compared to last month and a 23 per cent increase compared to November 2015.
Sales of apartment properties reached 1,200 in November 2016, an increase of 1.9 per cent compared to the 1,178 sales in October 2016 and a 22.7 per cent decrease compared to November 2015.The benchmark price of an apartment property is $512,100. This is unchanged from last month and is an 18 per cent increase compared to November 2015.
Attached property sales in November 2016 totalled 376, a decrease of 6.7 per cent compared to the 403 sales in October 2016 and a 40.9 per cent decline compared to November 2015. The benchmark price of an attached unit is $667,100. This represents a 0.3 per cent decrease compared to last month and a 23 per cent increase compared to November 2015.
To keep you up to date with the Real Estate Listings in Whistler, here is are links to all properties listed and sold in the last 7 days.
If you are interested in any of the properties or have any other questions, always feel free to contact us!
New listings in the last 7 days
Sold listings in the last 7 days

About Shauna
As an agent with the largest realtor network in Canada, Macdonald Realty, Shauna O’Callaghan, works locally on a national scale. Shauna’s excellent reputation is the result of unparalleled respect for clients and market smarts.
Market News
Sign Up for Market Updates and More!
Keep In Touch
Office
Macdonald Realty
#30, 1040 Legacy Way
Whistler, BC V0N 1B1
7409 Treetop Lane
Whistler, BC
Call Us
Mail to
© Copyright 2020 Shauna O’Callaghan – Site Crafted By: Whistler Web & Print